Every log responds to shale in a particular way and each shale bed has its own unique log response. Although log readings in shale fluctuate from foot to foot, their average values will be fairly constant over a large area of the country.
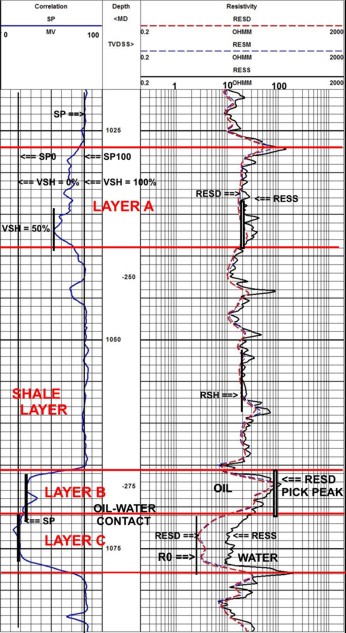
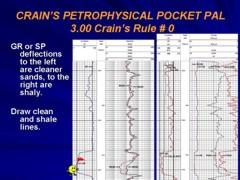
The SP deflects to the left in clean sand. In the cleanest sand, the maximum SP reading to the left of the shale base line represents the clean SP line (SP0). Note that other sands may not develop an SP to the same degree as the cleanest sand. Therefore, they are either shaly sands or else they have fresher water in them. The proportion of shale can be estimated by observing the actual SP deflection with respect to the clean sand and shale base lines. For example, the sand at 1060m has developed an SP of about 50% of the maximum amplitude. Therefore, this zone is about 50% sand and 50% shale. This is a rough approximation of shale content, but is often the only source of shale information in shaly sands on older logs where no gamma ray log exists. SP base lines generally drift to the left or right due to changing electrical conditions at the well. Draw the base line to conform to the drift. Measure the SP deflection between the base line horizontally and not at right angles to the base line. Most log analysis computer programs have a method for correcting the SP drift. SP curves can also be normalized to make the maximum and minimum deflections equal in all wells by rescaling the curves in the computer. Some geological information may be lost if normalization is performed - some shaly sands may become too clean. Note that if mud filtrate is saltier than the formation water, the SP shale base line will be on the left and the clean line will be on the right. This is the reverse of the normal situation.
GR curves can also be normalized to make the maximum and minimum deflections equal in all wells by rescaling the curves in the computer. Some geological information may be lost if normalization is performed - some shaly sands may become too clean. The
shale base line for both the gamma ray and SP may alter
with hole depth due to changes in logging instrumentation,
hole size, mud properties, and varying shale character.
Therefore, the shale base line should be chosen specifically
in the shales immediately below the formation of interest.
However, the clean line may have to be chosen quite some
distance from the zone of interest if no clean sands may
be nearby. If the well does not penetrate a shale below
the zone of interest, the shale base line must be chosen
from the nearest shale above the zone.
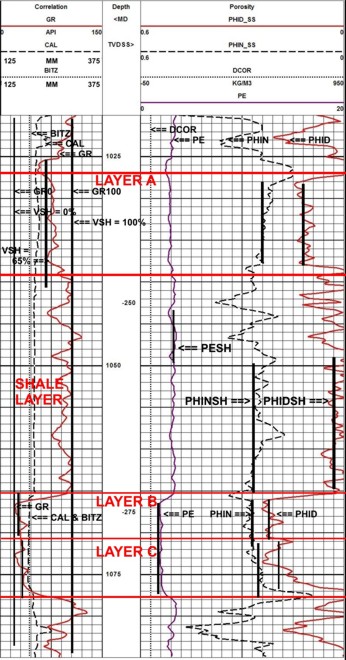
The gamma ray log is the most useful indicator of shale content, with some minor exceptions, such as in radioactive sands or radioactive dolomite. It is available on most wells logged since 1957. The sonic log also has a shale base line (DELTSH). It is the fairly straight section of the sonic log between l070 and l075m in our example. Shale content cannot be estimated elsewhere on the sonic log from this information alone. This value must be known so that porosity calculated from the sonic log can be corrected for shale. This is true also of the density (PHIDSH), neutron (PHINSH) and resistivity (RSH) logs, illustrated in Figures 6.01 and 6.03. It is therefore, helpful to document these values over the entire log interval for future reference.
Then, linearly interpolate a finer scale between the 0 and 1.0 points - such as the 0.0, 0.2, 0.4, 0.6, 0.8, 1.0 scale shown in the examples. From this scale, the shale content (Vsh) can be read for any point on the log. For example:
The values derived from the SP are unreasonable considering the data available in two of the four zones. Therefore, the values should be discarded, or new base lines picked, as shown above, and better Vsh values estimated. In this example, the SP resolution is too poor to be useful in Sand A, and the water resistivity versus filtrate resistivity contrast in Sand B prevents the use of the SP here.
Similarly, the separation between the density and neutron porosity logs can be scaled in shale units, as shown at the left. A scaler must be made equal in length to the distance between PHINSH and PHIDSH. The scale should be marked with 0.0 Vsh at PHINSH and 1.0 Vsh at the PHIDSH point. Slide the zero end of the scaler along the neutron log to read Vsh at each point desired.
If this procedure is used in a shaly sand, the density neutron log must be in sandstone units, and if used in a limestone section, the log must be in limestone units. Do not use this method in gas zones, dolomite, or anhydrite sections.
In Layer A, the lowest Vsh on the SP is 0.50 (marked on the log) and the average is about 0.60. On the GR, the average Vsh = 0.65. The minimum is 0.60 on average. Layer B shows about 0.05 on the SP and 0.00 on the GR - the minimum Vsh = 0.00. For Layer C, the SP gives 0.00 and the GR about 0.05 so Vsh = 0.00. Shale volume in the shale layer is 1.00 (100%) by definition.
Many "shales" are really shaly silts
or silty shales, so there may be reasons to move the 100% shale line
to the right of so-called "obvious shales" on the SP and GR logs.
Some radioactive zones are relatively clean sands or silts - check
the sample and core descriptions and get some X-Ray diffraction or
thin section point count data
to confirm the mineralogy. |
|
|||||||||||||||||||||||
|
Page Views ---- Since 01 Jan 2015
Copyright 2023 by Accessible Petrophysics Ltd. CPH Logo, "CPH", "CPH Gold Member", "CPH Platinum Member", "Crain's Rules", "Meta/Log", "Computer-Ready-Math", "Petro/Fusion Scripts" are Trademarks of the Author |
||||||||||||||||||||||||

|
||
| Site Navigation | SHALE VOLUME CRAIN'S RULES FOR VISUAL ANALYSIS | Quick Links |
 This
image illustrates the data for Classic Example 1, over clean
and shaly sands. A base line for the SP is shown on the
right hand side of the SP track. This line is called the
shale base line or the shale line (SPl00).
This
image illustrates the data for Classic Example 1, over clean
and shaly sands. A base line for the SP is shown on the
right hand side of the SP track. This line is called the
shale base line or the shale line (SPl00). The
gamma ray, like the SP, has a shale base line and a clean
line. Estimation of shale content is done by observation
of the gamma ray log with respect to the clean line (GR0)
and the shale base line (GRl00). The base lines for the
GR are shown at the right.
The
gamma ray, like the SP, has a shale base line and a clean
line. Estimation of shale content is done by observation
of the gamma ray log with respect to the clean line (GR0)
and the shale base line (GRl00). The base lines for the
GR are shown at the right.  There
is no strong reason why the adjacent shales should represent
the shale properties within the shaly sand, but the assumption
is made that this is a good first approximation. Shale properties
may need to be adjusted by comparing shale volume calculated
from logs with core description, thin section point count
data, X-ray diffraction data, or scanning electron microscope
data. Discrepancies between log analysis porosity and core
porosity may also indicate that shale base lines need to
be adjusted.
There
is no strong reason why the adjacent shales should represent
the shale properties within the shaly sand, but the assumption
is made that this is a good first approximation. Shale properties
may need to be adjusted by comparing shale volume calculated
from logs with core description, thin section point count
data, X-ray diffraction data, or scanning electron microscope
data. Discrepancies between log analysis porosity and core
porosity may also indicate that shale base lines need to
be adjusted.