|
 THIN SECTION
BASICS
THIN SECTION
BASICS
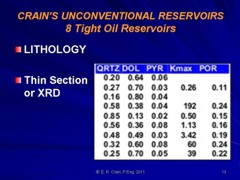
Petrographical analyses is an essential service providing estimates
of pore size distribution, grain size, sorting, porosity, and mineral
abundances, fabric, rock classification, porosity varieties and
abundances.
Results
include a determination of shale volume, shale
distribution, porosity varieties and abundances
with a discussion of diagenesis, diagenetic
sequence, porosity origins and development,
controls on porosity and permeability. Point
count data is presented in tabular form with
colour photomicrographs accompanied by detailed
descriptions.
 Core or chip samples are cleaned in a vapor
phase bath in an attempt to remove solvable excess residual
hydrocarbon. The samples are then impregnated with blue epoxy to
identify porosity and preserve textures, polished and mounted
onto a glass slide. The samples are then ground down to a
thickness of 30 microns and stained with a combined carbonate
stain of Alizarin Red-S (for calcite) and potassium ferricyanide
(for Core or chip samples are cleaned in a vapor
phase bath in an attempt to remove solvable excess residual
hydrocarbon. The samples are then impregnated with blue epoxy to
identify porosity and preserve textures, polished and mounted
onto a glass slide. The samples are then ground down to a
thickness of 30 microns and stained with a combined carbonate
stain of Alizarin Red-S (for calcite) and potassium ferricyanide
(for
ferroan carbonate).
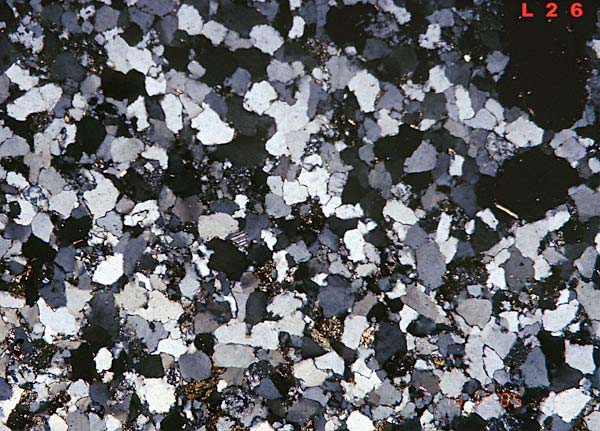
 Thin section microphotograph, blue colour is porosity,
other colours are different minerals Thin section microphotograph, blue colour is porosity,
other colours are different minerals
Finally,
a second glass slide is glued on the polished surfaces. The
prepared thin sections are examined petrographically. Individual
minerals are identified by their stained colour and crystal
structure (if visible).
Thin section "visual porosity" is called effective porosity in
petrographic reports. It is usually less than effective porosity
from logs or core analysis because it does not include
microporosity inside grains or rock fragments. Petrographic
reports sometimes refer to core porosity as "total porosity".
This is confusing, as the common usage of "total porosity" is
the sum of effective porosity (core porosity or log analysis
porosity) plus clay bound water. Consider the context.
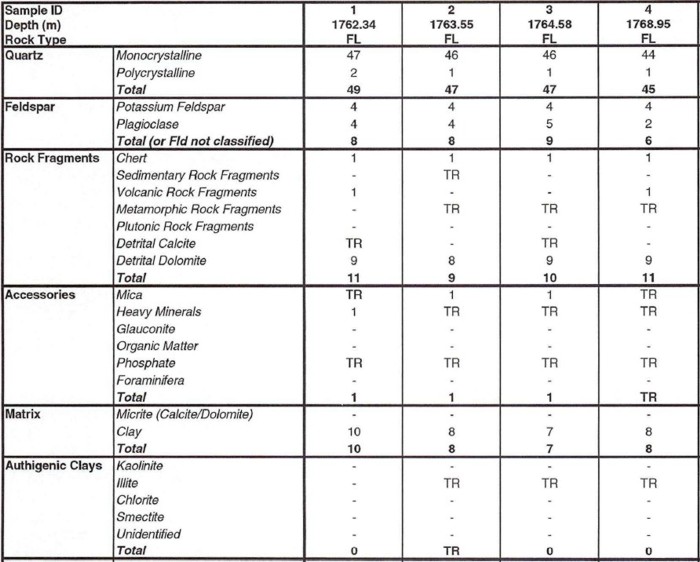
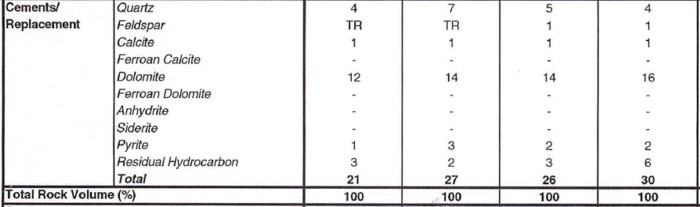
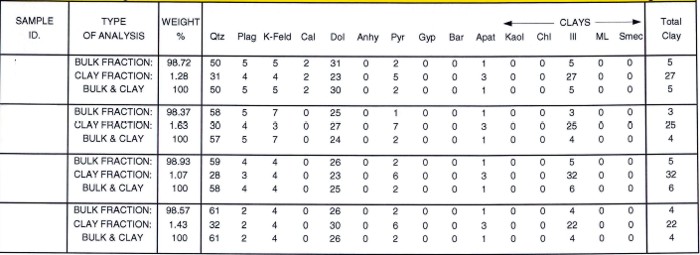
The petrographic data summary, including framework mineralogy,
diagenetic minerals and cements, textures, grain size range, and
average porosity and permeability, is provided in tabular form.
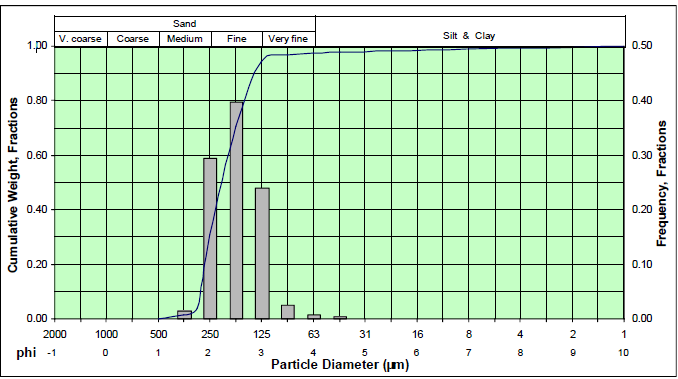
Grain size distribution histogram - tabular data for each sample
will also be supplied
Macro fracturing are usually visible with blue epoxy. To look
for possible micro fractures, a second set of thin sections are
made from the same samples. These are injected with fluorescence
Rhodamine-B red epoxy. These samples are examined and
photographed under ultra-violet (UV) light.
More detailed images may be made by scanning electron microscopy
(SEM) to assess pore geometry and grain texture.
THIN SECTION EXAMPLES
|