|
 Calculating Fracture Intensity
-
Crain’s Method Calculating Fracture Intensity
-
Crain’s Method
The various log derived fracture indicators can be merged through
a computer program which allows a wide variety of inputs. The
input curves are assigned a threshold value, a median value, and
a maximum probability as a fracture detector. In addition, each
input is weighted according to its correlation to natural fracturing
in the specific area. This form of program lends itself to a small
rule based expert system.
In
most areas, the major weighting is assigned to the shear attenuation
from the sonic waveforms and to dipmeter differential conductivity.
Lesser weighting is assigned to compressional attenuation, caliper
rugosity, density correction, deep to shallow resistivity ratio,
and uranium content. Where oblique fracturing are expected, the
shear input may be weighted lower and the compressional input
weighted higher. The output of the program is a fracture probability
curve.
A
simple form of the equation would look something like this
1.
CFI = ((RESS<RESD) + (PHID>PHIN+0.05) + (DTC>200)
+ (GR>150) + (PE>5.5) + (CAL>250)
+ (DCOR>250)
+ DELTA_CAL>50)) / NTEST
Where:
CFI = calculated fracture index (fractional)
RESS = shallow resistivity
RESD = deep resistivity
PHID = density porosity
PHIN = neutron porosity
DTC= sonic travel time
GR = gamma ray
PE = photo electric effect
CAL = caliper
DCOR = density correction
DELTA_CAL = differential caliper
NTEST = number of thresholds tested
This
equation is written for a specific case; curves can be added or
deleted and thresholds adjusted to suit the circumstances.
In the
above sample, units are Metric – CAL in mm, DTC = usec/m, and DCOR
in kg/m3.
The equation is trying to quantify the fracture location rules shown
in the examples of how each log curve responds to fractures.
You need to look at the logs to see what they are doing – are RESS
spikes lower or higher than RESD? Do all resistivity curves spike to
lower values? Set CAL, DCOR, and DELT trigger levels apptopriately
for the log response and log scales.
Whether
RESS is higher or lower than RESD will depend on mud resistivity and
zone is wey or oil/gas. If zone is wet, fresh mud gives RESS > RESD
as the mud invades the fracture. Fresg mud in fractures in oil zone
– usually RESS < RESD. Salt mud and oil-base muds would behave
differentlt.
In the example shown
above, all curves have equal
weight, and the amount of excursion of a curve beyond its threshold
is not considered. The result is normalized between 0.0 and 1.0
by the value of NTEST. More elaborate fracture intensity indicators
are common, using the amount of the curve excursion above the
thresld to weight that vurve's contribution to the total fracture
intensity.


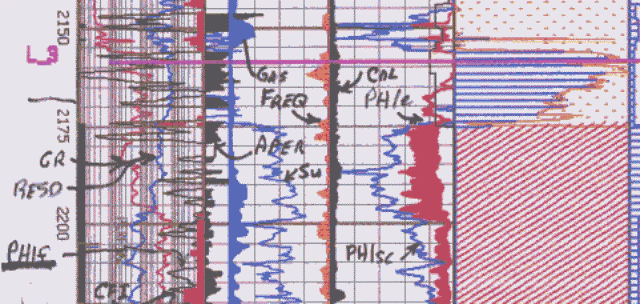
Open hole fracture indicator (CFI) compared to FMI results
The CFI curve and micro-scanner
fracture intensity (frequency or fractures per meter, labeled
FREQ) track each other reasonable well. There is a strong correlation between the FMI data, which
represents ‘ground truth’, and the CFI curve. This
does not always happen and the CFI must be calibrated to each
specific case.
Note
the Fracture Aperture (APER) and Fracture Porosity (PHIf) curve
values are very small, but typical of most fractured reservoirs.
Matrix porosity (PHIe) is significant and overwhelms the fracture
pore volume.
It
is sometimes possible to relate the sum of CFI over an interval
to drill stem test flow capacity (KH) or to well productivity
(IPR or AOF). CFI can also be compared and calibrated to fracture
intensity (fractures per meter) from formation micro-scanner processing.
This is useful when only a few wells have FMS or FMI data while
others do not.
|

