All of the techniques rely on a strong correlation between depositional environment and the energy needed to produce certain characteristics that we can see on well logs over the rock sequence. Depositional energy level correlates well to grain size, which in turn is usually proportional to shale volume. Thus the gamma ray or SP curve can augment environment estimates from dipmeter analysis. Low values of gamma ray (or high SP) indicate high energy, low shale content zones. These are inner shelf or upper continental slope in a marine environment, or alluvial or fluvial regimes on the continent. Higher shale volume indicates lower energy deposition; that is, deeper water outer shelf, lower continental slope, continental lacrustine, or paludal environments. Curve shape analysis depends almost entirely on the shape of the SP or GR curves versus depth, so the shale volume/grain size/depositional energy relationship is a strong component of our analysis method. The reconstructed resistivity curve from the dipmeter or a microresistivity curve can also be used as a grain size indicator in shaly sand sequences. An example is shown below, from a SYNDIP presentation.
A combination of curve shape and bedding patterns are used to differentiate the ambiguity obvious in the above discussion. Grain size alone, as indicated by shale content, is not a sufficient criteria to determine the environment, but it does help distinguish high, medium, and low energy environments.
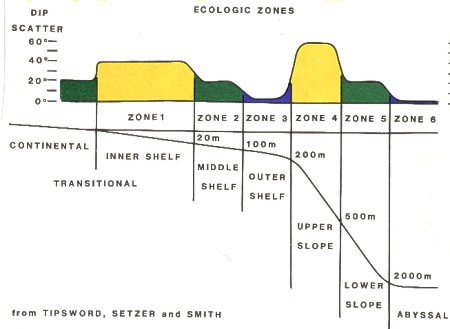
The continental slope and abyssal plain zones also have distinctive energy patterns, with very high energy at the upper slope, due to slumping and turbidity currents. Energy levels decrease rapidly with distance from the upper slope. This results in dip ranges of 60 degrees in the upper slope zone to a few degrees in the abyss, corresponding to Zones 4, 5, and 6. Dips on the continental zone range up to 20 degrees for fluvial deposits and 45 degrees for eolian and alluvial deposits.
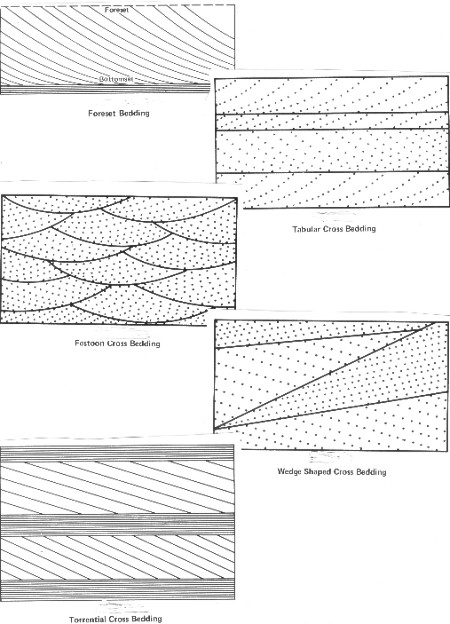
The term current bedding is used to describe the beds laid down in a channel parallel to the direction of current flow. The current beds will dip downward in the direction of the current flow and will be from a few inches to a few feet thick. Crossbedding, although the term suggests otherwise, is also parallel to the direction of current flow. However, crossbeds do not often occur in river channels but usually on the front of deltas or shallow marine sand bars. Crossbeds dip considerably more steeply, but in the same direction, as the dips of the delta or sand bar surface. Planar or tabular bedding, as the words suggest, involve flat layers of rock (maybe lying at an angle) laid down in streams, lakes, or in deltas. Festoon bedding creates layers which are convex top and bottom, and are usually laid down in braided streams. Wedge shaped or nonparallel bedding is planar bedding with concurrent erosion which has removed a portion of the bed, such as on the curve of a meandering river. Examples of these bedding patterns are given below.
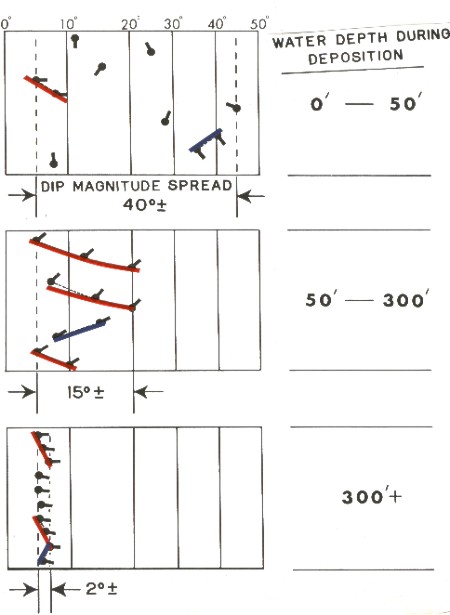
As described earlier, a strong correlation exists between depositional energy and grain size of the rocks. The larger the grain size, the greater the depositional energy. Therefore, steep current bedding, which can only be supported by large grains, is usually interpreted as high energy deposition. Flatter beds represent lower energy deposition. This rule usually holds when deposition occurs in a place away from the transportation artery, such as in a delta front or when deposition is associated with ocean wave energy. However, this rule could be broken when deposition and transportation occur simultaneously, as in a channel, where the highest energy may produce the flattest, even reversed, current bedding dips. Specific sedimentary environments give rise to characteristic patterns of current bedding dips versus depth. Such patterns, seen on the dipmeter plot, can be used to help identify the depositional environment. For example, most bar type deposits will exhibit a high dip angle in the upper part, decreasing to a low angle near the base.
To evaluate current bedding, its characteristics (type, angle, pattern, spread) and its orientation (direction and scatter) are considered together. The above tables should be used in conjunction with the sedimentary model descriptions given later in this Chapter. In case of a conflict between evidence supplied by the various approaches, current bedding patterns should overrule curve shapes, because the dipmeter has better resolution. This extends to the determination of the boundaries of genetic units. Sometimes the incoming material may change while the same depositional conditions persist, with the result that lithological unit boundaries may not match those of genetic units. One genetic unit may be made up of more than one lithological unit or vice versa. Interpretation involving sedimentary structures is based on genetic units and should not be too strongly influenced by lithology variations.
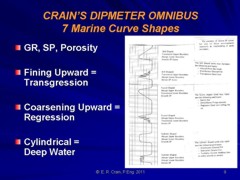
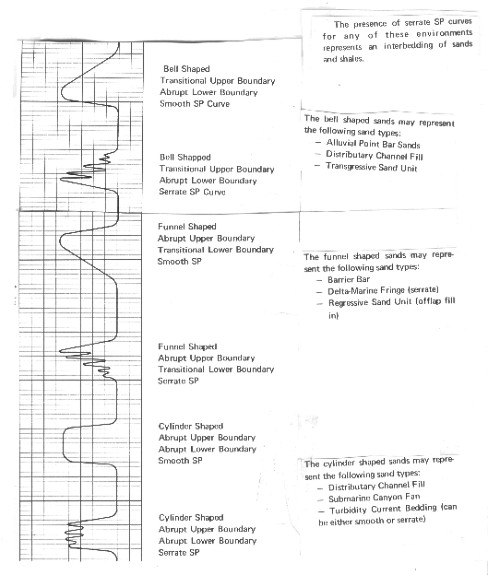
1. straight line, indicating constant shale, evaporite, clean sand, or carbonate, caused by continuous deep water deposition 2. bell shaped, indicating a fining upward sequence, ie., lower energy at the end of a cycle 3. funnel shaped, indicating a coarsening upward sequence, ie higher energy at the end of a cycle 4. cylindrical shaped, indicating constant energy throughout the cycle The last three are the usual patterns considered in an environment analysis. Variations exist. Serrated patterns are caused by abrupt changes in energy, resulting in layers of silt or shale interbedded in an otherwise regular pattern. Short patterns way be imbedded in longer ones. Thus, short coarsening upward patterns may contribute to a larger coarsening upward pattern. Patterns of all three kinds may be imbedded in one larger one.
|
|
||||||||||||||||||||||||||||||||||||||||||||||||||||||||||||||||||||||||||||||||||||||||||||||||||||||||||||||||||||||||||||||||||||||||||||||||||||||||||||||||||||||||||||||||||||||||||||||||||||||||||||||||||||||||||||||||||||||||||||||||||||||||||||||||||||||||||||||||||||||||||||||||||||||||||||||||||||||||||||||||||||||||||||||||||||||||||||||||||||||||||||||||||||||||||||||||||||||||||||||||||||||||||||||||||||||||||||||||||||||||||||||||||||||||||||||||||||||||||||||||||||||||||||||||||||||||||||
|
Page Views ---- Since 01 Jan 2015
Copyright 2023 by Accessible Petrophysics Ltd. CPH Logo, "CPH", "CPH Gold Member", "CPH Platinum Member", "Crain's Rules", "Meta/Log", "Computer-Ready-Math", "Petro/Fusion Scripts" are Trademarks of the Author |
|||||||||||||||||||||||||||||||||||||||||||||||||||||||||||||||||||||||||||||||||||||||||||||||||||||||||||||||||||||||||||||||||||||||||||||||||||||||||||||||||||||||||||||||||||||||||||||||||||||||||||||||||||||||||||||||||||||||||||||||||||||||||||||||||||||||||||||||||||||||||||||||||||||||||||||||||||||||||||||||||||||||||||||||||||||||||||||||||||||||||||||||||||||||||||||||||||||||||||||||||||||||||||||||||||||||||||||||||||||||||||||||||||||||||||||||||||||||||||||||||||||||||||||||||||||||||||||

|
||
| Site Navigation | STRATIGRAPHY DEPOSITIONAL ENVIRONMENT BEDDING DIP SPREAD | Quick Links |