|
 fractured reservoir basics
Natural fractures in reservoir rocks contribute
significantly to productivity. Therefore, it is important to
glean every scrap of information from open hole logs to
locate the presence and intensity of fracturing. Even
though some modern logs, such as the formation micro-scanner and
televiewer, are the tools of choice for fracture indicators, many
wells lack this data. Thus all known fracture location techniques
are described.
 Naturally
fractured reservoirs contain secondary or induced porosity in
addition to their original primary porosity. Induced porosity
is formed by tension or shear stresses causing fractures in a
competent or brittle formation. Fracture porosity is usually very
small. Values between 0.0001 and 0.001 of rock volume are typical
(0.01% to 0.1%) Fracture-related porosity, such as solution porosity
in granite or carbonate reservoirs, may attain much larger values,
but the porosity in the actual fracture is still very small. Naturally
fractured reservoirs contain secondary or induced porosity in
addition to their original primary porosity. Induced porosity
is formed by tension or shear stresses causing fractures in a
competent or brittle formation. Fracture porosity is usually very
small. Values between 0.0001 and 0.001 of rock volume are typical
(0.01% to 0.1%) Fracture-related porosity, such as solution porosity
in granite or carbonate reservoirs, may attain much larger values,
but the porosity in the actual fracture is still very small.
There
are, of course, exceptions to all rules of thumb. In rare cases,
such as the cooling of intrusives or surface lava flows, in which
natural fracture porosity may exceed 10%. When buried and later
filled with hydrocarbons, they form very interesting reservoirs.
Fracture
analysis literature in the 1970’s suggested that fractures
might contribute as much as a few to several percent porosity.
More modern work using fracture aperture calculated from resistivity
micro-scanner logs indicates much lower numbers. To appreciate
this, consider fractures with 1 millimeter aperture spaced 1 meter
apart. This gives a porosity of 0.001 fractional (0.1%). This
is a very large open fracture. Most are only microns in width,
so even 10 fractures of 10 microns each only give 0.0001 fractional
porosity (0.01%).
The
term “secondary porosity” also includes rock-volume
shrinkage due to dolomitization, porosity increase due to solution
or recrystalization, and other geological processes. “Secondary
porosity” should not be confused with “fracture porosity”.
Porosity formed in this way can be determined from modern log
suites without difficulty, except for porosity formed by fractures, which is
too small to detect with conventional logs.
 Fracture
porosity is found accurately only by processing the formation
micro-scanner curves for fracture aperture and fracture frequency
(fracture intensity). All other methods, including the well known
“dual-porosity” model, are extremely inaccurate. These
models either over-estimate fracture porosity by several orders
of magnitude, or cannot be applied because the log data does not
fit the model. All published models are described in this
Handbook
and the student or practitioner can decide whether or not to use
them. Fracture
porosity is found accurately only by processing the formation
micro-scanner curves for fracture aperture and fracture frequency
(fracture intensity). All other methods, including the well known
“dual-porosity” model, are extremely inaccurate. These
models either over-estimate fracture porosity by several orders
of magnitude, or cannot be applied because the log data does not
fit the model. All published models are described in this
Handbook
and the student or practitioner can decide whether or not to use
them.
The
effect of fracture porosity on reservoir performance, however,
is very large due to its enormous contribution to permeability.
As a result, naturally fractured reservoirs behave differently
than un-fractured reservoirs with similar porosity, due to the
relative high flow capacity of the secondary porosity system.
This provides high initial production rates, which can lead to
extremely optimistic production forecasts and sometimes, economic
failures when the small reservoir volume is not properly taken
into account.
Reservoir
simulation software that accounts for the fracture system is often
termed a “dual porosity” model. While this is strictly
true, it would be better to think of them as “dual permeability”
models, since the fracture permeability fed by the matrix or reservoir
permeability is far more important than the relative storage capacity
of the fractures and matrix porosity. A reservoir with only fracture
porosity is quickly depleted; a decent reservoir in the matrix
rock feeding into fractures will last much longer.
In
order to understand the behavior of naturally fractured reservoirs,
estimates must be made of hydrocarbons-in-place within both the
primary (matrix rock) and secondary (fracture-only) porosity systems.
To do this, we must first be able to detect the existence of fractures.
Therefore, this chapter covers fracture detection from the usually
available conventional logs, as well as the method used to partition
porosity into primary and fracture components. The effect of this
partitioning on the Archie water saturation equation is also described.
Modern methods for quantifying fracture porosity directly from
micro-scanner logs are also discussed.
Definition of Fractures
A fracture is a surface along which a loss of cohesion in the
rock texture has taken place. A fracture is sometimes called a
joint and, at the surface, are expressed as cracks or fissures
in the rocks.
The orientation of the fracture can be anywhere from horizontal
to vertical. The rough surface separates the two faces, giving
rise to fracture porosity. The surfaces touch at points called
asperities. Altered rock surrounds each surface and infilling
minerals may cover part or all of each surface. Minerals may fill
the entire fracture, converting an open fracture to a healed or
sealed fracture.
Fracture Porosity Definitions
Fractures are caused by stress in the formation, which in turn
usually derives from tectonic forces such as folds and faults.
These are termed natural fractures, as opposed to induced
fractures. Induced fractures are created by drilling stress or
by purposely fracturing a reservoir by hydraulic pressure from
surface equipment. Both kinds of fractures are economically important.
Induced fractures may connect the wellbore to natural fractures
that would otherwise not contribute to flow capacity.
Natural
fractures are more common in carbonate rocks than in sandstones.
Some of the best fractured reservoirs are in granite - often referred
to as unconventional reservoirs. Fractures occur in preferential
directions, determined by the direction of regional stress. This
is usually parallel to the direction of nearby faults or folds,
but in the case of overthrust faults, they may be perpendicular
to the fault or there may be two orthogonal directions. Induced
fractures usually have a preferential direction, often perpendicular
to the natural fractures. A schematic diagram of these relationships
is shown above, bottom right.
A
fracture is often a high permeability path in a low permeability
rock, or it may be filled with a cementing material, such as calcite,
leaving the fracture with no permeability. Thus it is important
to distinguish between open and healed fractures. The total volume
of fractures is often small compared to the total pore volume
of the reservoir.
Most
natural fractures are more or less vertical. Horizontal fracture
may exist for a short distance, propped open by bridging of the
irregular surfaces. Most horizontal fractures, however, are sealed
by overburden pressure. Both horizontal and semi-vertical fractures
can be detected by various logging tools.
The
vertical extent of fractures is often controlled by thin layers
of plastic material, such as shale beds or laminations, or by
weak layers of rock, such as stylolites in carbonate sequences.
The thickness of these beds may be too small to be seen on logs,
so fractures may seem to start and stop for no apparent reason.
To
be an aid in production, fractures must be connected to a
reasonable hydrocarbon bearing reservoir with sufficient volume
to warrant exploitation. If there is no reservoir volume, a lot
of fractures won’t help much unless there is sufficient fracture
related solution porosity to hold an economic reserve. This can
be determined by normal log analysis techniques. In reasonable
non-fractured reservoirs, it is usually possible to estimate
permeability, and hence productivity,
but this is not always possible in fractured reservoirs. Although
both the presence of fractures and the presence of a reservoir
can be determined from logs, a production test will be needed
to determine whether economic production is possible. The test
must be analyzed carefully to avoid over optimistic predictions
based on the flush production rates associated with the fracture
system. Local correlations between fracture intensity observed
on logs and production rate are also used to predict well quality.
 Sometimes
the primary reservoir and the fracture system may be so poorly
connected that they are saturated with different fluids. Production
from fractures full of hydrocarbons in a water bearing formation
may initially be very good but very short lived. A more desirable
scenario is a primary reservoir with appreciable hydrocarbon saturation
and a fracture system that is full of water close to the borehole,
showing invasion and hence good permeability, but full of hydrocarbon
in the uninvaded formation. Sometimes
the primary reservoir and the fracture system may be so poorly
connected that they are saturated with different fluids. Production
from fractures full of hydrocarbons in a water bearing formation
may initially be very good but very short lived. A more desirable
scenario is a primary reservoir with appreciable hydrocarbon saturation
and a fracture system that is full of water close to the borehole,
showing invasion and hence good permeability, but full of hydrocarbon
in the uninvaded formation.
Usung Logs to Locate Fractures
Fracture
location from well logs can be divided into two categories,
namely wells with image logs and wells without image logs. Using
conventional open hole logs is mandatory in older wells before
the era of image logs, and still widely needed today because
image logs are not always run where they are need. As a result
we are forced to ise what we have. Using conventional logs is
covered in the next Section.
Of
course, it would be preferable to run the right logs in the first
place. These would include the resistivity or acoustic image log and
the dipole shera sonic log. A preview of these modern logs is given
below, with more detail in Section 3. Case histories aree in Section
4.
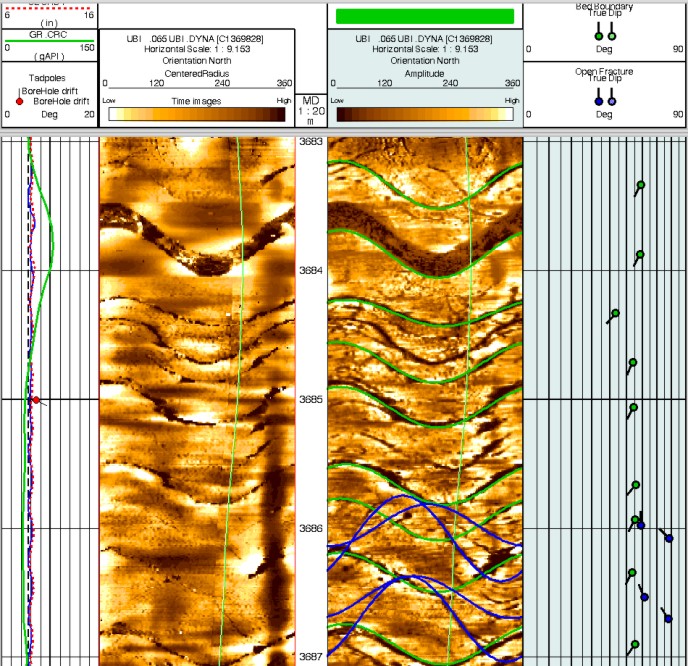
Acoustic Image log with travel time (detailed borehole
radius) at left and amplitude (acoustic impedance) on the right.
Fractures show up as black sinusoid shapes on both images. The
strike direction (azimuth) of the fracture can be picked at the
trough on the sinusoid and converted to a compass orientation using
the scale at the top of the log. Dip angle of the fracture can be
found by comparing the peak to peak amplitude of the sine wave (in
borehole depth units) to the borehole diameter (measued in the same
units).
DIP = arctan (Y/D) where Y = peak to peak distance and D = borehole
diameter.
With some skill and daring, the image
logs can be interpreted for open, healed, and induced
fractures, and the stress regime for each can be worked out seoarately.
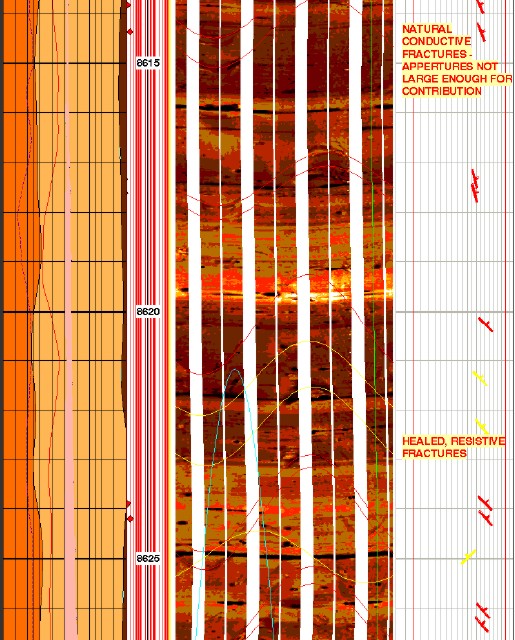
Resistivity
image log in fractured reservoir: gamma ray (left track, shaded
red), image track (middle) with open fractures (red sine waves and
healed fractures (yellow sine waves), dip track (right) shows red
amd yellow dip angle and azimuth. There are no induced fractures in
this short interval. Bedding planes are near horizontal. Imagine
trying to locate these steep dips without the aid of a computer.
.
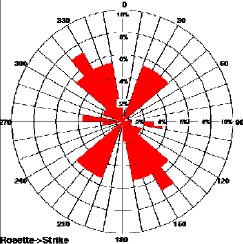
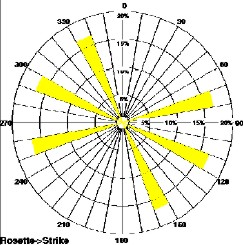
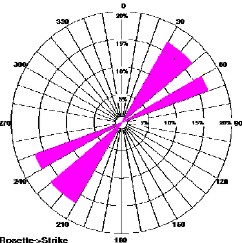
Induced fractures (top left) show current stress direction. Open
fractures (top right) show stress direction when fractures were
created, healed fractures (lower left) show different direction at
an earlier phase in geological time, and micro faults (lower right)
shows another stress regime was present when the faults occurred.
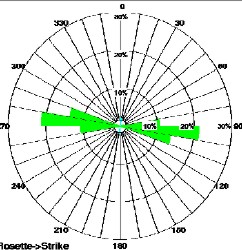
The
newest dipole shear sonic log is also an azimuthal tool with dipole
sources set at 90 degrees to each other. The example below shows the shear images for the X and Y directions. This
log can be run in open or cased hole.
Dipole shear image log shows directional stress
- the Fast Direction is centered on
90 degrees (east - west) which
is also the maximum stress direction.
|