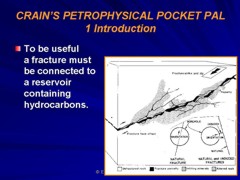
|
 Identification Of Fractures wiTh open hole logs
Most well logs respond in some way to the presence of fractures.
Each major log type is discussed in the following Sections with
respect to its fracture response. Not all logs detect fractures
in all situations, and very few see all fractures present in the
logged interval. Bear in mind that other borehole and formation
responses will be superimposed on each log. Moreover, it is not
normal to analyze a single log in isolation, but to review all
log curves together to synthesize the best, most coherent, result.
The list of possibilities is shown here:
1. spontaneous potential
2. caliper
3. micro resistivity
4. dipmeter and fracture identification
log
5. density, neutron, and photoelectric
effect
6. gamma ray and spectral gamma ray
7. resistivity
8. temperature
9. sonic travel time
10. sonic amplitude, and sonic wave train
11. resistivity image (microscanner)
12. acoustic images (borehole televiewer)
Because
we are stuck with the existing logs in the well files, this Chapter
covers the assessment of fractures from all these commonly available
logs, even though image logs are usually the tool of choice today.
On new wells in which fractures may be significant, we would run
the correct log suite for fracture identification. Depending on
local experience, this would be one or more of those on the following
list:
1.
High resolution laterolog (HRLL) or azimuthal resistivity image
(ARI) log with micro-SFLand gamma ray - required for
fracture detection and water saturation, ARI helpful
for fracture orientation
2. Density neutron log (CNL-LDT) with photo-electric
effect, gamma ray, and caliper -required for matrix
porosity, lithology, helpful for fracture detection
3. Dipole shear sonic image log (DSI) with gamma ray,
caliper, amplitude, waveform or variable density display
- required for porosity and mechanical properties
calculation, helpful for fracture detection and orientation
4. Natural gamma ray spectral log (NGT) -helpful for
fracture detection, certain areas only, helpful in
granite reservoirs to identify granite type,
required in uranium-rich rocks.
5. Formation micro-scanner image log (FMI) with gamma
ray plus fracture aperture and frequency post-processing
(FracVue) - strongly recommended, required for quantitative
fracture porosity and permeability, required for fracture
orientation
OR
5A. Ultra-sonic borehole imager (UBI) or televiewer
log with gamma ray plus dipmeter post-processing -
cheaper than micro-scanner but less sensitive, not
quantitative
Usually
at least two of these would be run for confirmation, but the microscanner
or televiewer are often sufficient when run alone. Caliper, gamma
ray, porosity, and resistivity logs are usually available as well,
so there is no shortage of data!
There
are a number of mechanical methods for locating fractures, which
will not be discussed further in this Chapter, except for the
brief outline given below. There is extensive literature on the
subject, especially on well testing, which should be referred
to. However, the log analyst needs to be aware of the possibility
and confirmation of fractures from these sources:
Identification Of Fractures BY other methods
1.
Drilling Characteristics
The occurrence
of lost circulation or mud loss, abrupt drilling breaks, bit bouncing
or torqueing, mud weight reduction, well kicks, oil on the mud
pit surface, large de-gasser volumes, oil or gas shows on mud
logs, calcite in well cuttings coming from fracture incrustations
or veins may be indications of fractures. A review of the well
history file is an important source of knowledge for the log analyst.
2.
Sample Descriptions
Observation of fractures, slickensides, calcite in healed fractures,
blocky or fissile texture may indicate fractures.
3.
Inflatable Packers
An impression of the borehole wall can be imprinted on the rubber
when the packer is set in place. If fractures are present, they
will be seen, but there is no way to tell if they were induced
by drilling or were present before drilling.
4.
Drill Stem Testing
Analysis of pressure transient data from flow and buildup tests
has been used extensively to indicate the presence of fracturing.
5. Core Analysis
Conventional core analysis can provide much information about
fractures. Visual observation of open and healed fractures, stylolites,
slickensides, fracture density, and fracture dip angle can be
made at the wellsite or in the laboratory. They can also be described
from core photographs under natural light,
and when oil is present, under ultraviolet light.
Core examination and core description show fractures
 If
the core itself is not available for direct observation, you may
find clues in the core analysis report or core descriptions, where
the words fractured, frac, rubble, or lost core are clues to the
presence of fractures. Descriptive information may not be transferred
into all data bases, so it pays to check the original documents. If
the core itself is not available for direct observation, you may
find clues in the core analysis report or core descriptions, where
the words fractured, frac, rubble, or lost core are clues to the
presence of fractures. Descriptive information may not be transferred
into all data bases, so it pays to check the original documents.
A
high permeability value in an otherwise low permeability environment
is another clue, as is an asterisk in the permeability column,
indicating a fractured core sample in which permeability could
not be measured. Large differences between maximum horizontal,
minimum horizontal, and vertical permeability also may indicate
fractures not seen by eye.
CORE ANALYSIS
DATA FOR 10-22-39-26W4
|
10223926W4 |
|
|
|
|
|
|
|
|
|
|
|
|
S# |
Top |
Base |
Len |
Kmax |
K90 |
Kvert |
Porosi |
GrDen |
BkDen |
Soil |
Swtr |
Lithology |
|
|
meters |
meters |
meter |
mD |
mD |
mD |
frac |
kg/m3 |
kg/m3 |
frac |
frac |
|
|
25 |
2122.00 |
2122.28 |
0.28 |
120.00 |
50.70 |
28.80 |
0.101 |
2810 |
2627 |
0.001 |
0.412 |
DOL I VUG CARB VFRAC |
|
26 |
2122.28 |
2122.64 |
0.36 |
11.30 |
5.64 |
8.23 |
0.064 |
2830 |
2713 |
0.001 |
0.182 |
DOL I PPV LV VFRAC |
|
27 |
2122.64 |
2122.86 |
0.22 |
547.00 |
82.00 |
92.20 |
0.105 |
2830 |
2638 |
0.106 |
0.212 |
DOL I VUG STY VFRAC |
|
28 |
2122.86 |
2123.05 |
0.19 |
2110.0 |
2110.0 |
2110.0 |
0.147 |
2810 |
2544 |
0.000 |
0.103 |
DOL I PPV SV CARB |
|
29 |
2123.05 |
2123.47 |
0.42 |
5350.0 |
2880.0 |
32.70 |
0.146 |
2810 |
2546 |
0.087 |
0.174 |
DOL I VUG CARB STY VFRAC |
|
30 |
2123.47 |
2123.67 |
0.20 |
560.00 |
166.00 |
443.30 |
0.148 |
2790 |
2525 |
0.080 |
0.353 |
DOL I MV LV CARB VFRAC |
|
31 |
2123.67 |
2124.10 |
0.43 |
16.00 |
11.30 |
12.00 |
0.074 |
2820 |
2685 |
0.001 |
0.247 |
DOL I VUG CARB VFRAC |
|
32 |
2124.10 |
2124.53 |
0.43 |
15.90 |
14.20 |
11.06 |
0.104 |
2840 |
2649 |
0.000 |
0.205 |
DOL I VUG |
|
33 |
2124.53 |
2124.80 |
0.27 |
5.27 |
3.36 |
1.02 |
0.048 |
2890 |
2799 |
0.000 |
0.133 |
DOL I PPV SV ANHY |
|
34 |
2124.80 |
2125.18 |
0.38 |
267.00 |
113.00 |
11.70 |
0.129 |
2830 |
2594 |
0.001 |
0.290 |
DOL I VUG |
|
35 |
2125.18 |
2125.44 |
0.26 |
192.00 |
130.00 |
11.80 |
0.079 |
2840 |
2695 |
0.113 |
0.271 |
DOL I VUG STY |
|
36 |
2125.44 |
2125.70 |
0.26 |
421.00 |
95.50 |
25.90 |
0.071 |
2830 |
2700 |
0.001 |
0.410 |
DOL I VUG STY VFRAC |
|
37 |
2125.70 |
2126.00 |
0.30 |
572.00 |
572.00 |
1282.0 |
0.129 |
2830 |
2594 |
0.001 |
0.560 |
DOL I VUG |
|
38 |
2126.00 |
2126.21 |
0.21 |
10000 |
10000 |
5.81 |
0.116 |
2830 |
2618 |
0.001 |
0.273 |
DOL I VUG |
|
39 |
2126.21 |
2126.42 |
0.21 |
2.49 |
2.12 |
0.81 |
0.070 |
2830 |
2702 |
0.000 |
0.250 |
DOL I VUG |
|
40 |
2126.42 |
2126.75 |
0.33 |
55.60 |
30.80 |
2.12 |
0.097 |
2840 |
2662 |
0.053 |
0.191 |
DOL I VUG |
|
41 |
2126.75 |
2126.95 |
0.20 |
82.20 |
17.00 |
1.88 |
0.144 |
2840 |
2575 |
0.043 |
0.072 |
DOL I VUG |
|
42 |
2126.95 |
2127.19 |
0.24 |
196.00 |
48.10 |
0.44 |
0.133 |
2840 |
2595 |
0.062 |
0.198 |
DOL I VUG |
|
43 |
2127.19 |
2127.38 |
0.19 |
8.35 |
7.63 |
0.06 |
0.118 |
2840 |
2623 |
0.077 |
0.196 |
DOL I VUG |
|
44 |
2127.38 |
2127.70 |
0.32 |
1840.0 |
1700.0 |
0.21 |
0.103 |
2830 |
2642 |
0.047 |
0.207 |
DOL I VUG |
|
45 |
2127.70 |
2127.94 |
0.24 |
23.60 |
20.50 |
0.23 |
0.117 |
2830 |
2616 |
0.001 |
0.182 |
DOL I VUG FOSS |
|
46 |
2127.94 |
2128.09 |
0.15 |
27.90 |
21.00 |
0.96 |
0.153 |
2830 |
2550 |
0.108 |
0.432 |
DOL I VUG |
|
47 |
2128.09 |
2128.38 |
0.29 |
107.00 |
8.50 |
0.07 |
0.130 |
2830 |
2592 |
0.000 |
0.285 |
DOL I VUG |
|
48 |
2128.38 |
2128.79 |
0.41 |
533.00 |
338.00 |
102.00 |
0.075 |
2840 |
2702 |
0.000 |
0.504 |
DOL I PPV MV |
|
49 |
2128.79 |
2129.26 |
0.47 |
40.20 |
11.30 |
5.19 |
0.068 |
2830 |
2706 |
0.046 |
0.130 |
DOL I VUG STY VFRAC |
|
50 |
2129.26 |
2129.76 |
0.50 |
2340.0 |
1800.0 |
99.70 |
0.097 |
2820 |
2643 |
0.068 |
0.370 |
DOL I VUG |
|
51 |
2129.76 |
2130.32 |
0.56 |
1670.0 |
708.00 |
532.00 |
0.122 |
2820 |
2598 |
0.055 |
0.398 |
DOL I VUG CARB VFRAC |
|
52 |
2130.32 |
2130.83 |
0.51 |
62.30 |
19.80 |
6.16 |
0.086 |
2810 |
2654 |
0.000 |
0.427 |
DOL I VUG CARB VFRAC |
|
53 |
2130.83 |
2131.14 |
0.31 |
2110.0 |
1770.0 |
698.00 |
0.142 |
2820 |
2562 |
0.000 |
0.534 |
DOL I VUG CARB |
|
54 |
2131.14 |
2131.60 |
0.46 |
226.00 |
20.90 |
6.76 |
0.075 |
2830 |
2693 |
0.121 |
0.338 |
DOL I VUG |
|
55 |
2131.60 |
2131.94 |
0.34 |
37.50 |
16.30 |
5.62 |
0.075 |
2840 |
2702 |
0.118 |
0.037 |
DOL I VUG |
|
56 |
2131.94 |
2132.15 |
0.21 |
90.40 |
36.40 |
7.00 |
0.062 |
2830 |
2717 |
0.204 |
0.082 |
DOL I VUG |
|
57 |
2132.15 |
2132.54 |
0.39 |
30.80 |
16.60 |
1.92 |
0.073 |
2830 |
2696 |
0.261 |
0.104 |
DOL I PPV LV VFRAC |
|
58 |
2132.54 |
2132.67 |
0.13 |
81.90 |
48.10 |
88.90 |
0.129 |
2840 |
2603 |
0.180 |
0.072 |
DOL I PPV SV VFRAC |
|
|
|
|
|
|
|
|
|
|
|
|
|
|
|
Arithmetic Averages |
0.36 |
875.1 |
672.8 |
165.8 |
0.104 |
2830 |
2640 |
0.054 |
0.260 |
|
Core data
listing for Carbonate Reef Example – partial listing over
gas-oil contact.
 Notice the high permeability streaks on the core analysis caused
by fractures. Lower values show matrix permeability. The VFRAC
(vertical fracture) notations in the description column are a
pretty good clue, too. Notice the high permeability streaks on the core analysis caused
by fractures. Lower values show matrix permeability. The VFRAC
(vertical fracture) notations in the description column are a
pretty good clue, too.
Observation of the core porosity versus
permeability crossplot is another good piece of evidence; a
shotgun pattern ias a really good indicator of fractures.
Core porosity versus
permeability
crossplot in a fractured reservoir 
The
dip direction and strike can be determined, if the core has been
oriented with directional data. Cores can also be oriented by
comparing observed bedding plane and fracture dips with those
from a dipmeter analysis or by paleomagnetic orientation. Bedding
plane and fracture plane dip angle and direction are determined
by tracing the visible portion of the plane on the core surface
with a goniometer, a fancy word for a three axis (X-Y-Z) digitizer.
Originally mechanical devices, they are now electronic and interfaced
to computers for calculation of the best fit dip plane and subsequent
presentation of data listings and displays.
6. Thin Section Petrology
Special core and sample analysis techniques are used in
fractured reservoirs, in addition to those normally performed to
obtain porosity, permeability, and electrical characteristics.
The major technique involves epoxy injection at formation
pressure to fill all pores and open fractures. Whole slabs or
thin sections are viewed or photographed under plane or
ultraviolet light. Pore structure, fracture connections to
isolated pores, fracture intensity, width, extent, and
direction, and anhydrite or calcite filled fractures are
recorded. Results are plotted versus depth and on rose diagrams.
Epoxy filled thin section for fracture location
7. X-Ray Tomography (CAT Scans)
X-ray
tomography of cores, a non destructive, non invasive technique,
may see fractures not visible to the naked eye. Open fractures
with sufficient width and macro porosity appear as dark (fluid
filled) pixels on the computer screen. Both horizontal slices
and vertical reconstructed slices can be viewed on the computer
screen. Micro porosity and narrow fractures may not be distinctly
visible because the resolution is on the order of a millimeter
or larger, not as good as the photomicrographs described above.
X-Ray tomography for fracture detection
More X-Ray tomography for fracture
Analysis
by colour coded partitioning of histograms is commonly used to
highlight particular features, such as porosity, mineralogy, or
invaded fluids. Since the colour coding used to represent the X-ray
count rate is proportional to density, healed or filled fractures
are easily identified when the filling mineral is different than
the matrix. Fractures and porosity are shown in black, calcite filled fractures as yellow, and dolomite matrix
as orange.
The
bottom left image portrays an anhydrite filled fracture (blue) with vuggy
porosity (black) and mud invasion (also blue). The matrix, dolomite,
is color coded yellow. Colors will vary under user control, so
be sure you understand where the color break points are and what
they are supposed to represent. Some ambiguity may exist, as in
this last example. Visual examination is used to corroborate problematic
situations.
Invasive
X-ray tomography, using an aqueous sodium iodide solution to fill
pores and fractures, is also used. A pressure sleeve is required,
but resolution is better than the native state method, due to
the high X-ray response of the injected fluid.
|