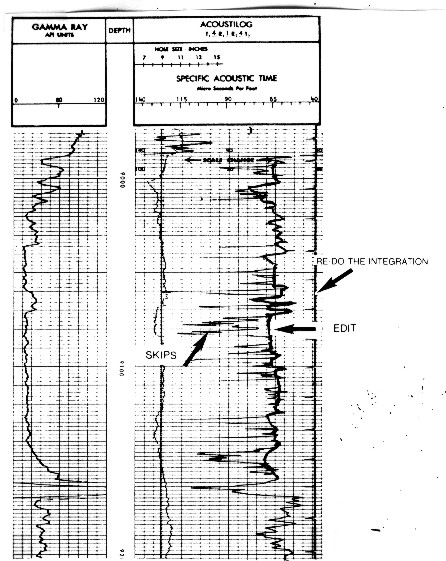
NOTE: When the integration tics on a sonic log are being used, and edits are needed, the integration must also be re-done. This is true after ANY editing method has been applied. When longer intervals are noisy, it may not be possible to identify the background log. It is common to refer to offset wells, where some logs may be better quality, and use the general trend of log values as a guide to editing. A method suggested by Brian Ausburn in 1977 recommended the preparation of composite sonic versus depth and density versus depth graphs from a number of wells. By choosing only data that did not suffer from noise, the graph could indicate the value to use during an edit of a noisy log. Separate graphs for shales, sandstones, and carbonates are made and used based on known or assumed lithology. Since the gamma ray log is not strongly affected by bad hole, it is used to differentiate shales from other rocks. Generalized geological knowledge is used to differentiate sandstones from carbonates. Since porosity in carbonates does not vary linearly with depth like sandstone does, trend lines for carbonates might not be very useful. If evaporites such as coal, salt, anhydrite, or potash minerals are present, correct values for these minerals are known and can be inserted (see table below).
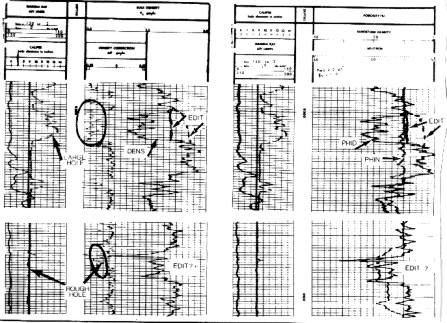
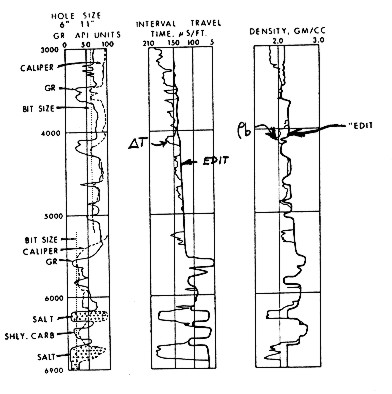
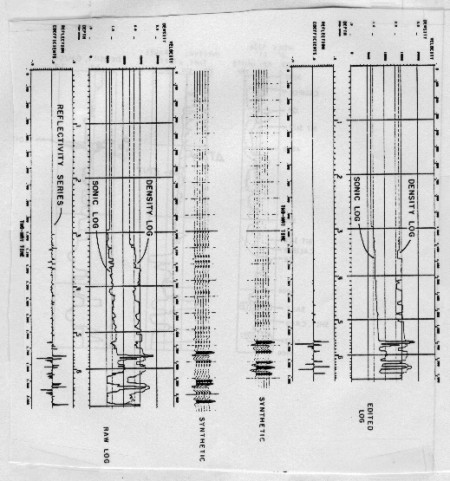
Interval 3000 - 5520: a sand/shale sequence, most shales are washed out, yet the majority of sands remain in gauge. The combination of hole enlargement and shale alterations results in apparent shale velocities and densities lower than actual formation values. This judgment is often based on trend curves developed from other wells in the area, where hole conditions for the equivalent stratigraphic section are superior. In this simulated example, the correction trend is substantiated by observed shale velocity values in sections where the hole has no wash out, as at 4960-5220 and 5370-5220. If a mechanical reason for hole washout cannot be determined, the substitution value should be considered carefully. It is possible the zone washed out because it is different from the nearby equivalent zones. Shale alterations and washouts also affect the density log. Hole problems can be subdivided into rugosity and enlargements. Rugosity is sufficient to cause density log errors with little hole enlargement. Both are corrected by applying modeling techniques described later. Interval 5520-6900: a mixed section of limestone, sandstone, shale and salt. With the exception of a few obvious hole washouts noted on the caliper in shale sections, the majority of editing is related to the salt section. Note that the density log has been edited from 6790-6900 even though the hole is in gauge throughout that section. Due to a different electron/bulk density relationship for salt, from most other sedimentary rocks, the apparent log bulk density of salt is not the true bulk density. By contrast, the sonic response in the good hole salt section substantiates the validity of the sonic edits in the washed out salts. The example below compares synthetic seismograms that would be obtained from raw and edited log data. As predicted from the severity of edits shown above, the differences in synthetic seismograms are significant.
Note that the shallow section of the synthetic from unedited data has more character than from edited data. These apparent events represent only the observed contrasts in the erroneous information and not any real acoustic impedance contrast in the subsurface. The
last major event from the unedited set occurs at approximately
2.030 seconds, while on the edited version this event occurs at
approximately 1.875 seconds. This difference reflects the significance
of the uphole velocity in achieving depth/time ties between seismic
and wellbore data. In this case, the too slow velocity observed
on the uphole portion of the raw log could make a difference of
500 to 1,000 feet in the location of the deeper events. Raw log
data generally makes a synthetic too long, but invasion in gas
zones and vuggy porosity can make it too short. |
|
||
|
Page Views ---- Since 01 Jan 2015
Copyright 2023 by Accessible Petrophysics Ltd. CPH Logo, "CPH", "CPH Gold Member", "CPH Platinum Member", "Crain's Rules", "Meta/Log", "Computer-Ready-Math", "Petro/Fusion Scripts" are Trademarks of the Author |
|||

|
||
| Site Navigation | EDITING WITH TREND ANALYSIS | Quick Links |