|
 Fracture Intensity and Initial Flow Rate (Schafer’s
Method)
Fracture Intensity and Initial Flow Rate (Schafer’s
Method)
Since the productive potential of fractured wells cannot be determined
easily with conventional logs and Archie's saturation equation,
an alternative technique of open hole analysis was proposed by
Schafer to identify and eliminate poor wells which would not pay
out.
A
quantitative expression of fracture intensity (SFI) was derived
from the dipmeter log and empirically related to established production
histories. The SFI
of 16 wells was then plotted against second month average daily
production for each and an equation was selected to fit the observable
relationship. Finally, economics of well pay out were applied
in order to assign a commercial cut off SFI value.
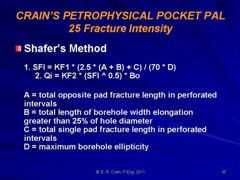
Shafer’s fracture intensity (SFI) analysis
based on dipmeter anomalies
The
equations developed by Shafer are:
1.
SFI = KF1 * (2.5 * (A + B) + C) / (70 * D)
2. Qi = KF2 * (SFI ^ 0.5) * Bo
Where:
A = total opposite pad fracture length on FIL in perforated intervals
(ft or m)
B = total length of borehole width elongation greater than 25%
of hole diameter (ft or m)
C = total single pad fracture length on FIL in perforated intervals
(ft or m)
D = maximum borehole ellipticity (short / long diameters)
SFI = fracture intensity index (unitless)
Qi = initial flow rate (bbl or m3)
Bo = oil formation volume factor (vol per vol)
KF1 = 1.00 for English units
KF1 = 0.3048 for Metric units
KF2 = 1.00 for English units
KF2 = 0.159 for Metric units
Payout
is expected when SFI > 2.0 for oil wells with no gas sales,
and when SFI > 1.6 for oil wells with gas sales. The constants
in equation 1 should be calibrated for each area and will vary
with average gas/oil ratio.
Large
borehole elongations in fractured reservoirs indicate the intersection
of major fractures, which pass completely through the borehole.
Flow capacity (millidarcy feet) will increase as A and B footage
values increase. These two parameters quantify the fracture indicators
that contribute most significantly to production.
Parameter
C indicates small scale fractures limited in extent. Single pad
fracture footage on the FIL generally has little or no corresponding
hole washout. Fractures of this nature will contribute hydrocarbons
initially, especially after artificial stimulation, but due to
the small potential reservoir production will rapidly drop off.
The
degree of borehole ellipticity, D, was chosen to be an indicator
of fracture width or intensity of fracture spacing. Fracture width
or spacing intensity will determine permeability and therefore
affect well capacity. Assuming this, then borehole ellipticity
will be inversely proportional to well productivity.
The
dipmeter log parameters described above were determined for the
Austin Chalk in Texas and Louisiana. They are used as quantitative
indicators of well capacity and correlate reasonably with initial
well flow rate. However, other variables which complicate the
relationship must be considered, such as gas/oil ratio, fracture
treatments, well mechanical problems, partial reservoir depletion,
and reservoir changes external to the borehole. Gas/oil ratio,
which can vary greatly even between offsetting wells, will affect
flow rate. Well stimulations, such as acid wash or hydraulic fracturing
, will normally increase initial production beyond that predicted
by the above correlations.
|