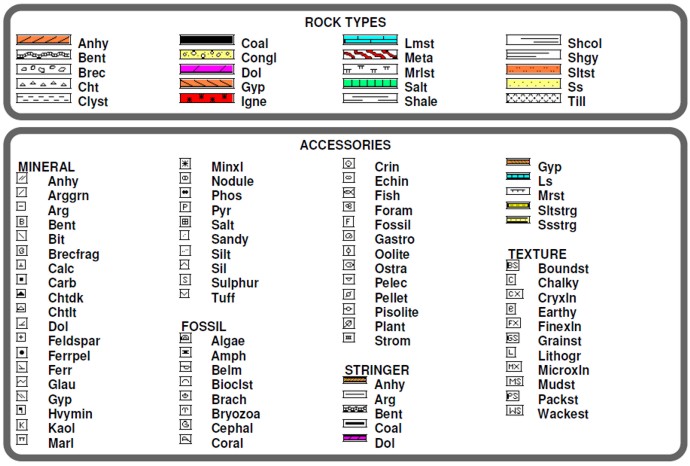
For a complete list of
abbreviations and symbols used in geological sample descriptions,
see This List.
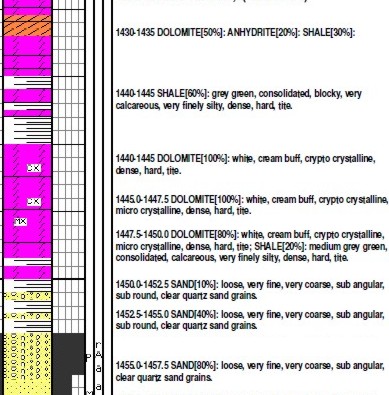
Typical lithology
codes from a modern petrophysical software package
|
|
||
|
Page Views ---- Since 01 Jan 2015
Copyright 2023 by Accessible Petrophysics Ltd. CPH Logo, "CPH", "CPH Gold Member", "CPH Platinum Member", "Crain's Rules", "Meta/Log", "Computer-Ready-Math", "Petro/Fusion Scripts" are Trademarks of the Author |
|||

|
||
| Site Navigation | MINERALOGY PLOT CODES | Quick Links |
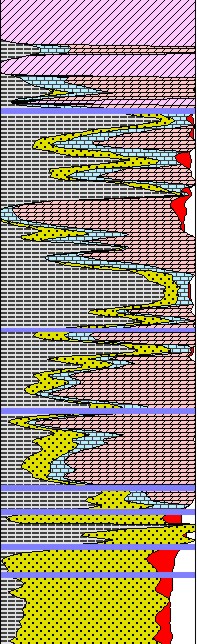
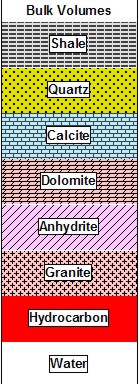 Lithology
coding on petrophysical analysis depth plots is less detailed than
on sample description logs. The codes are somewhat limited by the
software designer but the colours are usually under user control.
Lithology
coding on petrophysical analysis depth plots is less detailed than
on sample description logs. The codes are somewhat limited by the
software designer but the colours are usually under user control.