Other Shale Volume Methods
All of these alternate shale volume methods are more than adequate, but suffer from strict limitations on their use. EPT and capture cross section are rare log curves.

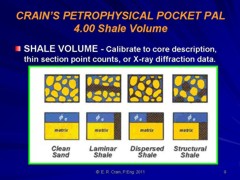
A number of useful shale volume methods have more restricted The reader should take a moment to define the parameters and work a hypothetical numerical example.

Shale Volume from Electromagnetic Propagation Attenuation
The electromagnetic propagation attenuation curve works well, especially in thinly bedded sand-shale sequences because the tool has a bed resolution of 4 to 6 inches. Attenuation increases with shale volume.

      1. VSHept = (ATTEN - ATTEN_CLN) / (ATTEN_SHL - ATTEN_CLN)
      2:  VSHept = Min(1, Max(0, VSHept))

Shale Volume from Deep Resistivity
The deep resistivity sometimes can be used in hydrocarbon bearing zones, especially tar sands. Calculated shale volume will be too high in water zones or swept zones when the water is fairly salty (WS > 10000 ppm NaCl), so another method, such as the SP or GR, should be used as well. Resistivity decreases with higher shale volume. The method is very useful in shallow shaly sands where kaolinite or feldspar makes the gamma ray read high. 

The clean and shale resistivity values can be picked from suitable cross plots or from depth plots.

For the resistivity log method, the use of the logarithm of the resistivity log values (and base line values) works better than linear values, as follows:

      3. VSHresd = (log(RESD) - log(RESD_CLN)) / (log(RESD_SHL) - log(RESD_CLN))
      4:  VSHresd = Min(1, Max(0, VSHresd))

Note that RESD_CLN is greater than RESD_SHL

 Shale Volume from Shallow Resistivity
In many shaly sands that are invaded with normal drilling mud filtrate (Rmf >= 0.50 ohm-m), the shallow resistivity may be a good shale indicator. Again, this is a very useful method in feldspathic sandstones, and there is better bed resolution than the deep resistivity. Do not use microlog or microspherically focused log as RESS.

      5. VSHress = (log(RESS) - log(RESS_CLN)) / (log(RESS_SHL) - log(RESS_CLN))
      6:  VSHress = Min(1, Max(0, VSHress))

Shale Volume from capture cross section
Some newer neutron logs produce a capture cross section curve (SIGMA) which mimics a gamma ray log in shaly sands:

      7. VSHsig = (SIGMA – SIG_CLN) / (SIG_SHL – SIG_CLN)
      8:  VSHsig = Min(1, Max(0, VSHsig))

All cased hole thermal decay time logs display a SIGMA curve as one of the primary measurements. Although there are hydrocarbon effects, the curve can sometimes be used to overcome problems with the gamma ray log, such as uranium precipitation on casing or tubing, or missing GR log.

Shale Volume from Photo Electric Effect
This method is not very accurate as the spread between PE of quartz and shale is not large.

      9. VSHpe = (PE – PE_CLN) / (PE_SHL – PE_CLN)
      10:  VSHpe = Min(1, Max(0, VSHpe))

PE of quartz is between 1.6 to 1.8 and illite shale is near 3.5. l

Even More Methods
The equations reproduced in the table below provide most of the known relationships for calculating shale volume. This material is reprinted courtesy of Dresser Atlas.


Page Views ---- Since 01 Jan 2015
Copyright 2023 by Accessible Petrophysics Ltd.
 CPH Logo, "CPH", "CPH Gold Member", "CPH Platinum Member", "Crain's Rules", "Meta/Log", "Computer-Ready-Math", "Petro/Fusion Scripts" are Trademarks of the Author