One measure of a good log analysis is that results should match ground truth reasonably well. In the case of shale volume calculations, ground truth is usually rather sparse and, if present, may be qualitative instead of quantitative.
Samples are well mixed by the mud circulation so these descriptions include rock chips from a fairly large interval. In addition, cavings from above the sampled interval will continue to contaminate deeper samples. Samples also take a long time to reach the surface, so their source depth is not perfectly established. The time taken to reach the surface is called the lag time. Lag time is calculated by comparing estimated borehole volume with mud pump capacity and speed. It is checked periodically by adding a chemical tracer to the mud and measuring how long it takes to detect the tracer back at the surface. A good wellsite geologist will correlate his description to the shape of the drilling time log. Later, the sample depths may be adjusted to the open hole logs, especially gamma ray, resistivity and density logs. The geologist will also eliminate most caving from the descriptions.
Your log analysis should show 80 to 100% shale where the geologist shows “shale” or “mudtstone”. The results should show 0 to 10% shale where the samples indicate clean sandstone, limestone, dolomite, anhydrite, salt, or mixtures of these minerals. Some shale should show on your analysis where the samples contain shale or clay minerals. A precise match is probably impossible due to the inherent limitations of sample descriptions. At least the samples will eliminate calculation of shale when in fact the zone is a radioactive sandstone or dolomite.
Clays and shales are easily identified as to quantity and type. One petrological term can be confusing to log analysts. The word “matrix” is used to describe fine-grained minerals (often clays) surrounded and between larger mineral grains. Log analysts use the term “matrix” to mean all the minerals that make up the rock, excluding shale and pore space.
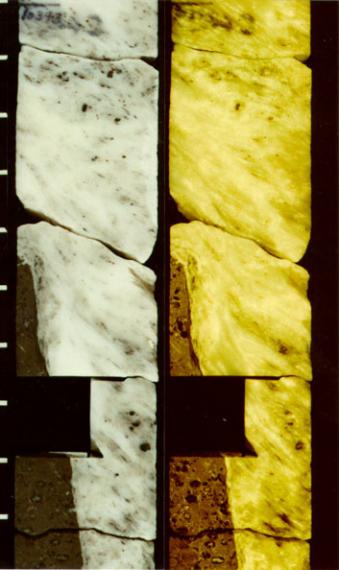
In
this example, clay volume of the dry samples ranges between 35 and
53%. Porosity and clay bound water need to be added back, based on
assumptions derived from log data in clean sands and pure shales, or
on compaction trend lines. If porosity and clay bound water are
approximately equal, the shale volume is equal to the clay volume in
the table, and no further manipulation is needed. |
|
||||||||||||||||||||||||||||||||||||||||||||||||||||||||||||||||||||||||||||||||||||||||||||||||||||||||||||||
|
Page Views ---- Since 01 Jan 2015
Copyright 2023 by Accessible Petrophysics Ltd. CPH Logo, "CPH", "CPH Gold Member", "CPH Platinum Member", "Crain's Rules", "Meta/Log", "Computer-Ready-Math", "Petro/Fusion Scripts" are Trademarks of the Author |
|||||||||||||||||||||||||||||||||||||||||||||||||||||||||||||||||||||||||||||||||||||||||||||||||||||||||||||||

|
||
| Site Navigation | SHALE VOLUME CALIBRATION TO GROUND TRUTH | Quick Links |