|
 CROSSPLOTS FOR CLAY TYPING
Clay
typing from well log data is usually accomplished by using
crossplots of potassium and thorium data from the gamma ray
spectral log and the photo electric effect. If the shale is somewhat
silty, the non-clay minerals will skew the results, requiring a
detailed multi-mineral model calculation. Density, neutron, and PE
data will also help sort out clay types.
|
Th/K Ratio |
|
High |
Kaolinite |
| |
Chlorite |
| |
Montemorillonite |
| |
Illite |
| |
Mica |
| |
Glauconite |
| |
Feldspar |
|
Low |
Potassium
evaporate |
 THORIUM / POTASSIUM CROSSPLOTS
The
thorium/potassium ratio method of visually identifying
clay-type can be used with the aid of the table at the right, or
with the calculator shown below..
Thorium is recorded in parts per
million (ppm) and potassium in percent (%), and the Th/K ratio is
therefore in units of (Th-ppm) / (K-%). For example if THOR = 9 ppm
and POTA = 3.0%, the ratio is 9 / 3 = 3.0. This is in the mid-range
of these ratios and the interpretation could be illite clay or mica
or both in this
shale.
This
ratio is illustrated graphically below.

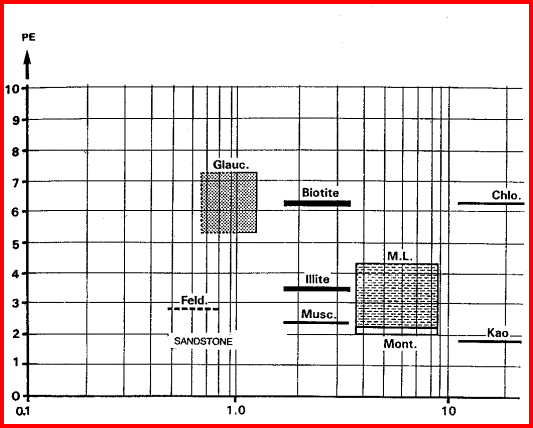
PE vs Th/K Ratio Crossplot for Clay Typing. Thorium is
recorded in ppm and Potassium in % by
volume, so units on X axis are ppm / %. The PE value helps
distinguish between minerals with similar Th/K ratios. Note that
clay and mica minerals do not hve unique values but ranges of
values for Th/K and some have a wide rangee for PE as well.
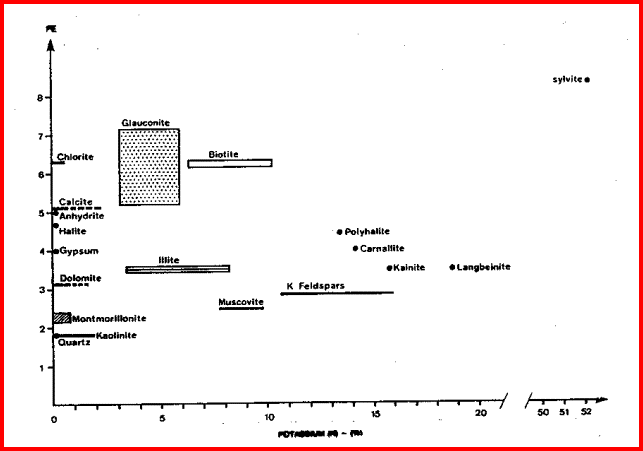
 PE / POTASSIUM CROSSPLOTS
This crossplot distributes the clay minerals in the X-Y space
somewhat differentky than the PE vs Th/K crossplot. It may give
better resolution in some mineral combinations. Two and three
mineral models can be developed for various mineral mixtures.

PE vs Potassium Crossplot for Clay Typing. If data
points fall to the left of the clay points, the
data is from a silty shale or calcareous shale. Units on X axis are
Potassium % by volume.
 Ush - Apparent Matrix Photoelectric Cross Section of
Shale
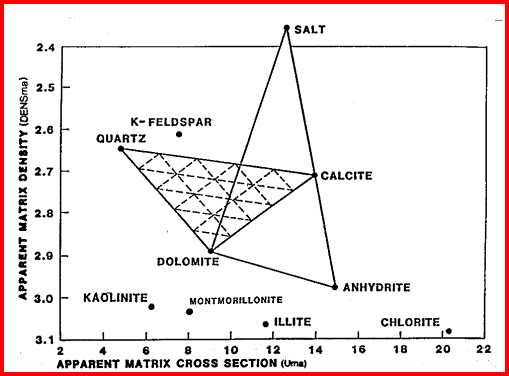
The matrix
density (DFNSma) versus matrix cross section (Uma) crossplot is
usually used to solve a 3-mineral model, but it can be used for clay
typing by plotting data from shale intervals. If data is in porosity
units, convert PHIDSH to density with equation 2. Calculate Ush from
equation 3. Plot DENSSH on vertical axis and Ush on horizontal axis.
1: PHIt = (PHINSH + PHIDSH) / 2
2: DENSSH = PHIDSH * KD1+ (1 - PHIDSH) *
KD2
3: USH = PESH * DENSSH / PHIt
Where:
KD1 = 1.00, KD2 = 2.65 for Sandstone scale or 2.71
for Limestone scale
DENSSH = density log reading in shale (gm/cc)
PESH = effective photoelectric cross section in shale (barns/cm3)
PHINSH = neutron porosity in shale (fractional)
PHIDSH = density porosity in shale (fractional)
PHINSH = neutron porosity in shale (fractional)
USH = photoelectric absorption of shale (barns/cm3)

Matrix Density vs Matrix Cross Section Crossplot
for Lithology. If plotted data points fall
above the clay points, the data is from a silty shale or a
calcareous shale.
|

