|
 WHAT YOU NEED TO KNOW BEFORE YOU START
This page covers a brief overview of computer aided log evaluation,
sometimes erroneously called computer processes interpretation
software (CPI). Computer software can analyze, process, evaluate,
get answers – but it cannot interpret. That’s your job!
My original version of this webpage was written in 1983-84 as part
of an AI project, and times have changed a bit since then. So this
is a totally new version for 2021 and beyond. Forty years agp, there
were over 50 software packages named in my original survey. None of
the tradenames still exist. All have either disappeared or been
absorbed by new corporate ventures. A few have evolved to keep up
with current computer capabilities, gaining new tradenames along the
way. You may find results from some of these gems in your well
files.
Today there are fewer than a dozen commercially viable petrophysical
software packages. I don’t intend to review or recommend any of
them. Test drive a few, talk to other users, and above all check how
responsive the support team is.
Most come suppkied wirh basic deterministic analysis algorithms and
some have advanced functions like multi-mineral, neural network, or
statistica / probabilistic models. A user-defined-equqtion (UDE)
editor is absolutely essential. No system has all the math you will
need for the vast variety of special cases you will run across in
your career. Virtually all the algorithms you may need to add can be
found in this Handbook.
None of the systems can choose the “Best” analysis model for a
particular geological sequence, or pick any of the parameters
needed. That’s your main task as a petrophysicist. To do this
effectively, you need to know how the math works. Take a course or
check out Chapters 11 through 17 in this Handbook.
You also get to check results against ground truth and re-compute
until all available data is reconciled.
Plot results in a uniform manner and include core porosity and
permeability on top of the log analysis results to show how well
your results match ground truth. Be sure to annotate tops, tests,
perfs, cores, and any other helpful data.
 HOW IT WORKS
This
section shows how the comouter aidded log analysis system works and
how it integrates with other disciplines in the organization.
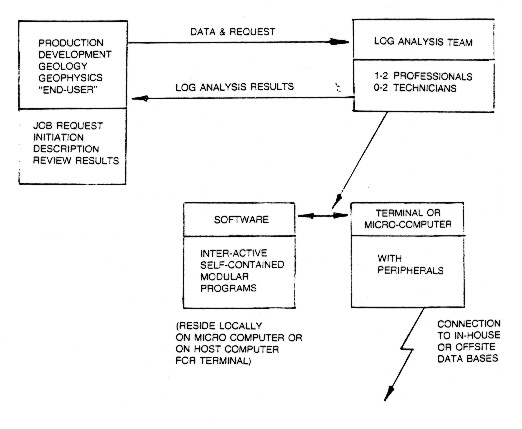
The computer-aided petrophysical system
The
interconnecting links in the system are its most important feature.
Good communication must exist, along with mutual trust and understanding,
between the "user" (the engineer, geologist or geophysicist)
and the "doer" (the petrophysicist).
The analyst in turn, must effectively communicate with the computer
hardware-software package and staff.
A
good system must be built around a team concept, consisting of
the lead or senior petrophysicist, a junior or trainee analyst, up
to two technicians, and possibly a clerk/technologist. Some of
these people are shared or "float" to projects as needed.
The
senior analyst is responsible for project definition, parameter
and method selection, difficult editing, work scheduling and organization,
review of intermediate and final results, presentation and discussion
of final results with the end-user, and training and work allocation
of subordinates. He must have a thorough knowledge of log analysis
methods, and be aware of all the available features on the hardware /
software package. He can run the package effectively after a few
days exposure to it and can modify programs to suit special cases
or local requirements.
The
more junior members of the team run the package under the direction
of the analyst. and perform the many clerical tasks involved in
organizing and filing large volumes of data. These people must
be keen and adept in the use of computers.
Log
analysis should be performed on a definable zone - not on an entire
well at once. As many zones as needed are run to cover all potential
pay sections.
The
entire well may be analyzed, but as a series of discrete zones.
A run control sheet is used to describe the zones to analyze,
the data available, the computation method, and parameters required,
as well as a brief well history to aid the analyst. The well history
is also annotated on the final results to aid discussion and understanding
of the log analysis by others.
On
large projects, a group of 5 to 10 related zones, preferably cored
and tested, will be picked, digitized, and computed as a "batch".
These are reviewed, parameters adjusted as needed, recomputed,
reviewed again and eventually finalized. In the earlier stages
of a large project, the batches consist of those zones with the
most core and DST data available. These zones are used to calibrate
log analysis parameters before un-cored zones are analyzed. The
organization of this procedure and the data bases required are
illustrated in the block diagram below.
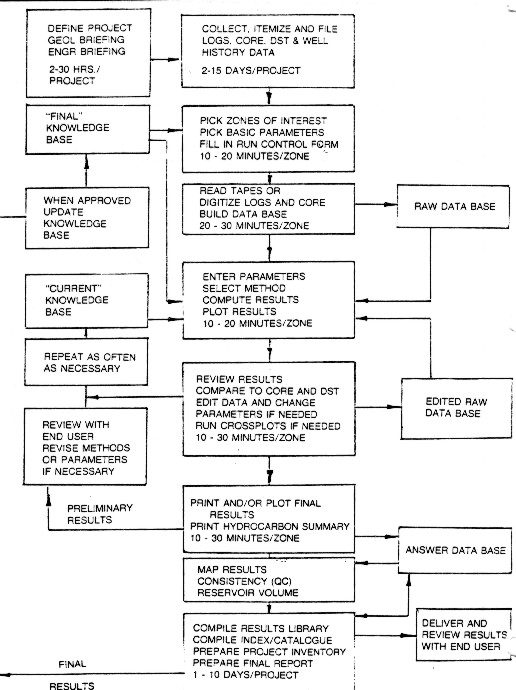
Data flowchart for computer-aided log analysis system
These
stages may seem simple, even trivial or obvious, but clear definitions
benefit the end-user and the analytical team, not to mention
management, who may have no idea how petrophysics is really done. Large projects or
continuous, on-going projects slow down if the job stream or data
structure is unorganized or chaotic.
The
two feedback loops shown above indicate that successive
re-runs to optimize methods or parameters are easy, rapid,
normal, and
probably necessary.
This
is the key to satisfying both the technician and the professional
analyst, because individual zones are usually finished completely
in just a few elapsed hours instead of days or weeks. A reasonable
number of zones (5-20) may be interleaved, so that different functions
are performed on different zones. This is a natural outcome of
the variable number of times the zone has to be re-computed.
In
smaller organizations, the analysis team may be one person, and
in some instances, the team and the end-user may be the same person.
This does not change the need to organize and review data and
results.
Other
organizations use a dispersed or distributed systems approach,
in which the end-user, or their technical staff, do their own
log analysis. This may be successful if training and standards
are excellent, and specialists are available for certain jobs
and for training.
 SOME EXAMPLES
 Example 1: Tight Oil - Silt/Sand

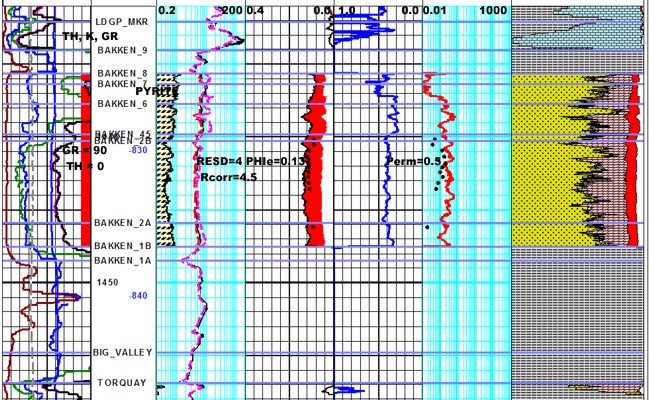
Here is a different well with the pyrite correction applied to the
resistivity log. The before and after
versions of the resistivity are shown in Track 2, along with the
pyrite fraction determined from a
3-mineral model using PE-density-neutron logs. The correction raises
the resistivity about 0.5
ohm-m and reduces water saturation by about 10%. Making the pyrite
more conductive would
raise RESD further, but as yet no one has provided any public
capillary pressure data in this area
to calibrate SW. The SWir from an NMR log would also help calibrate
this problem.
 Example 2: GAS Shale - dolomitic sand/silt


This example is the same well as the first image in this series,
showing results based on a fixed matrix density and matrix sonic
travel time, used to obtain a good match to core in the cored
interval. Both porosities are shown (blue is sonic, left edge of
red shading is density). The kerogen correction is buried in the
false matrix values required to get the results to match the
core data. There is nothing criminally wrong with this approach
when mineralogy and TOC are roughly constant, but that is not
the case here. TOC weight percent varies from 1 to 3%, which
translates into 2 to 7% by volume. Clay, quartz, and dolomite
volumes also have large ranges.
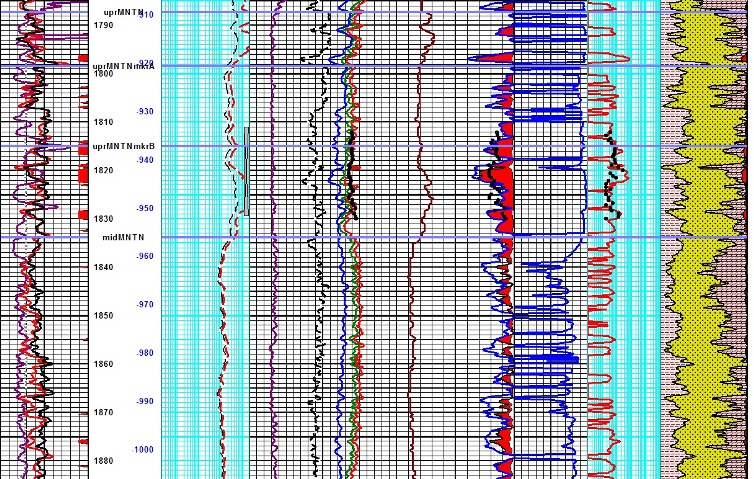
 EXAMPLE 3: Oil SAND - unususal fluid distribution

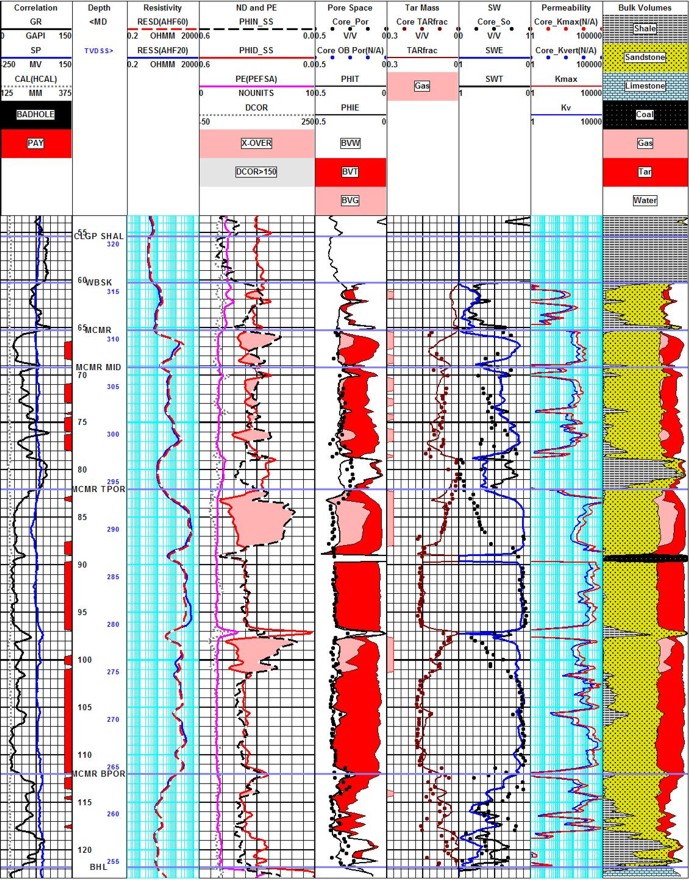
Oil sand analysis with top water, bottom
water, top gas, and mid zone gas. Core and log data match - but oil
mass is the critical measure of success. Core porosity matches total
porosity from logs, due to the nature of the summation of fluids
method used in these unconsolidated sands. Minor coal streaks occur
in this particular area.
|

