|
 Seismic Data Acquisition
Seismic data originates with a source of impulsive acoustic energy
near the surface of the ground. Dynamite, air guns, or vibrating
plates are used on land or marine surveys. In addition, a falling
weight is sometimes used for shallow land surveys and a sparker
survey is sometimes used for shallow marine work. The acoustic
energy passes through the earth in all directions. Some is reflected
back to the surface by acoustic impedance barriers, as shown
below. Here, the returned energy is sensed by geophones
planted on the ground or floating near the surface of the water.
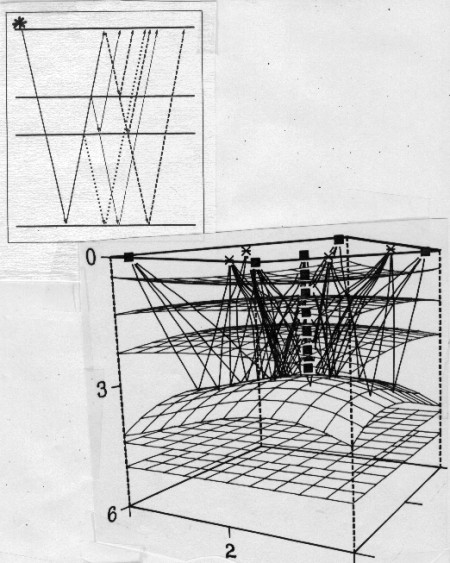
Geometry of seismic acquisition, 2-D survey (top) and 3-D
survey (bottom)
Some
reflected energy bounces back and forth more than once. These
events are called ghosts if they occur in the near surface, and
multiples if they come from deeper reflectors. Multiples and ghosts
are a form of interference which is usually eliminated by suitable
data processing.
Each
geophone signal is recorded on digital magnetic tape or disc and
presented as a wiggly trace of energy amplitude versus arrival
time. Raw traces are seldom delivered as the final product. Considerable
data processing is performed to correct for geometry, the filtering
effect of the earth, and amplitude decay with depth.
In
2-D seismic, the source and geophones are located in a straight
line, resulting in a seismic cross section. If the line cannot
be straight due to topography, the data is processed to collect
data in short approximations to straight lines.
For
3-D seismic, receivers and sources are set up in a pattern which
allows simultaneous recording of many intersecting lines of data.
These can be processed to provide a volumetric view of the subsurface.
4-D
seismic is a term used to describe surveys taken on the same grid
several years apart and are used to show changes in reservoir
properties over time. These can only be due to changes in fluid
content from production or injection. The results are used to
evaluate production efficiency, the effectiveness of waterfloods,
or monitor aquifer influx.
4-C
seismic is a relatively new form of marine survey and refers to
four component recording of the seismic signal. The components
are the usual compressional or P-wave from a geophone, plus in-line
and cross-line shear arrivals, as well as a compressional wave
recorded on a hydrophone. The different response of the geophone
and hydrophone to reverberations in the water allow specialized
processing to remove interference.
Anywhere from 24 to several hundred surface points are recorded
for each surface shot. The energy source is then moved a
multiple or sub-multiple of the geophone spacing and the signal
recorded again. If the movement is less than half the geophone
spread length, then the same subsurface points will be recorded
more than once, resulting in multi-fold coverage. The seismic
traces from different surface layouts that fall at common depth
points are collected and stacked together to improve signal to
noise ratio. The improvement in data quality with increased
coverage is shown below.
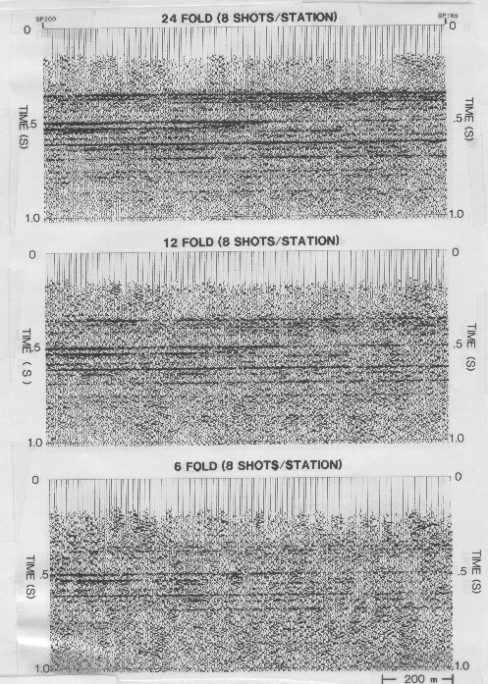
Multi-fold (stacked) seismic sections
The
presentation of seismic sections has evolved over the years, from
plain wiggly traces to variable intensity black and white or color
displays. The color can represent signal amplitude,
frequency content, or any other desired (and determinable) property
of the seismic signal. 3-D seismic is often presented in color
as vertical or horizontal slices, as isometric views, or as contour
maps.
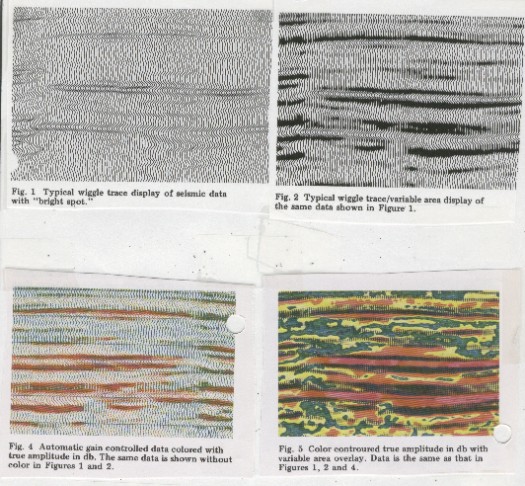
Seismic presentation options
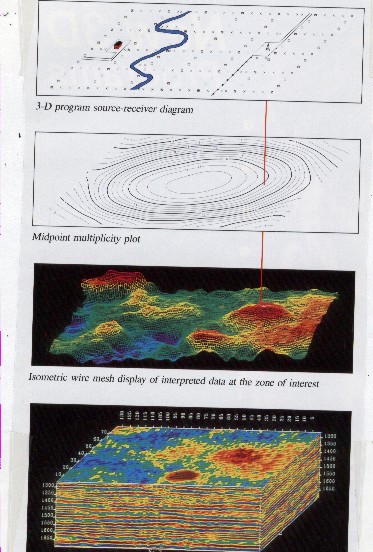
Mapping, slicing, and isometric views of
3-D seismic data
Most
log analysts are unfamiliar with these displays, making it difficult
for them to communicate well with geophysical interpreters.
|