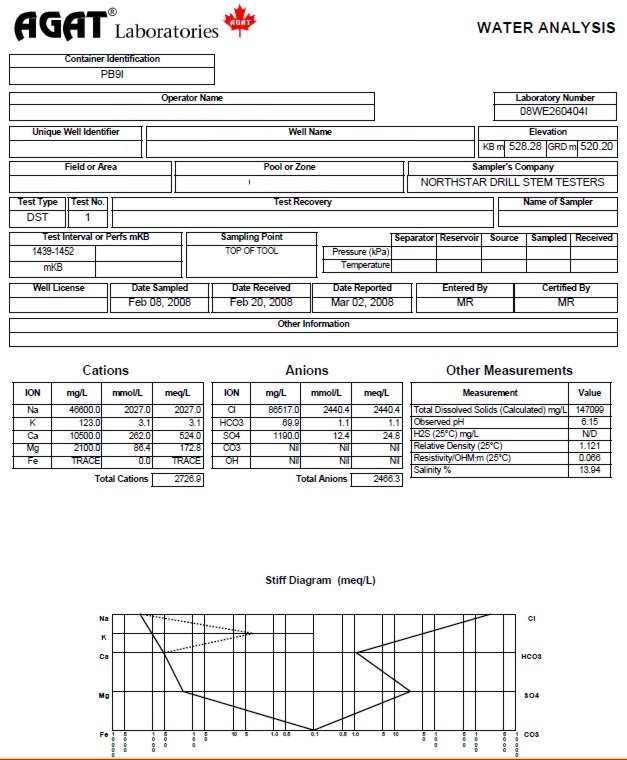
They also measure, in a routine analysis, the pH, relative density, and resistivity (Rw) of the water sample. The Rw is measured in ohm-m and they will record the temperature at which it was measured. This temperature will be used to adjust the measured Rw to a common "laboratory temperature", usually 25 Celsius or 77 Fahrenheit. Some labs use different standard temperatures.
Some labs also provide mmol/l (or moles/m3). mg/l (or g/m3) divided by the molar mass of the ion equals mmol/l (or moles/m3). Since mg/l is the same thing as g/m3, mmol/l is the same thing as mol/m3. Molar mass is derived from the atomic weight of the ion on the Periodic Table. For instance, the atomic weight of S is 32 and the atomic weight of O is 16, so the molar mass of SO4= 32 + 4 * 16 = 96.
Most labs calculate milli-equivalents (MEQ). MEQ equals mmol/l or moles/m3 multiplied by the valence or charge of the ion. SO4 has a negative charge of 2 so 1 mmol/l of SO4 equals 2 MEQ of SO4. Sodium (Na) has a positive charge of 1, so 1 mmol/l of Na equals 1 MEQ of Na.
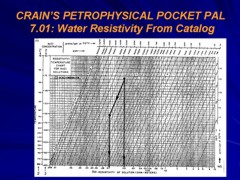
The logging company charts that convert ppm to Rw are based on ppm of pure NaCl. This is because the most common formation waters found in the world are NaCl based. These charts will give you the wrong Rw if the fluid is a mud filtrate which is mostly Na2SO4 or if the fluid is Sodium Bicarbonate type formation water.
The diagram at the bottom of the water analysis is called a Stiff Diagram. It is a graphical representation of the different ions. The shape of the Stiff Diagram can become a “fingerprint” which can allow us to distinguish whether the fluid is formation water or an introduced fluid, and can often distinguish the zone from which the formation water was produced.
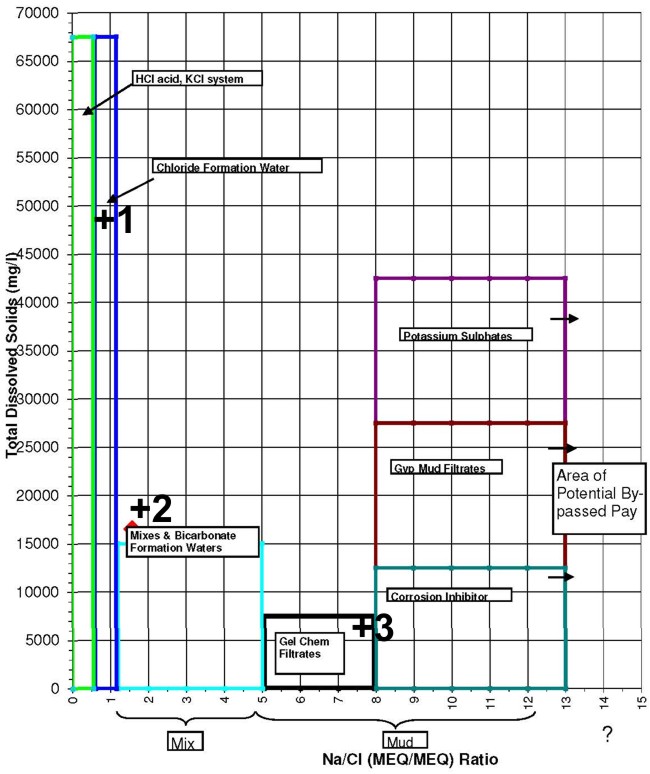
The Canadian Water Resistivity Catalog is well screened, but field samples may be contaminated. The following rules of thumb are useful in detecting mud filtrate contamination or meteoric water recharge. 1. Mg/l and ppm are approximately the same thing except in very saline waters. 2. Most gel-chem mud filtrates are usually from 3000 to 8000 mg/l TDS. 3. When the log header says gel-chem mud, they might mean gyp’ed-up mud. Gyp’ed-up mud usually has soda ash added to compensate for drilling through anhydrites. Gyp’ed-up mud filtrates are usually from 10,000 to 25,000 mg/l TDS. 4. KCl mud filtrates are usually from 30,000 to 50,000 mg/l TDS with lots of K and lots of Cl. 5. Potassium Sulphate mud filtrates are usually from 50,000 to 80,000 mg/l TDS with lots of K and lots of SO4. 6. Salt-saturated mud filtrates are usually 300,000 mg/l or higher. 7. Generally speaking, formation waters increase in salinity with depth but see #12. 8. Each zone should have a unique formation water “fingerprint” or Stiff Diagram unless it is hydraulically connected to another zone. 9. This formation water “fingerprint” may change with location in the basin. 10. Most formation waters have a milli-equivalent Na/Cl ratio of 0.6 to 1.2. 11. Many formation waters are fresher than expected as they are affected by fresh water recharge from the surface. These recharge waters have a distinctive fingerprint which is high in bicarbonates and the milli-equivalent Na/Cl ratio is usually between 2 and 3. These fresh waters have been found in formations as deep as the Devonian and can under-run more saline formation waters. 12. Never rely on one water analysis as being representative of the formation water in a particular pool and field. Try to find at least three water samples in your pool that have formation water characteristics, are close to the same TDS and have similar “fingerprints”. Then compare the Rw on your samples to the ones in the catalog.
Agat Lab in Calgary uses a "Smart Chart", incorporating these rules, to help identify clean water samples from those contaminated by mud filtrate or other chemicals.
|
|
||
|
Page Views ---- Since 01 Jan 2015
Copyright 2023 by Accessible Petrophysics Ltd. CPH Logo, "CPH", "CPH Gold Member", "CPH Platinum Member", "Crain's Rules", "Meta/Log", "Computer-Ready-Math", "Petro/Fusion Scripts" are Trademarks of the Author |
|||

|
||
| Site Navigation | FORMATION WATER ANALYSIS METHODS IN THE LABORATORY | Quick Links |