|
 Displaying Seismic Inversion Traces
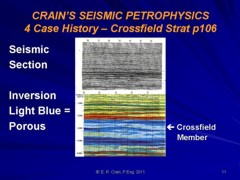
Closely spaced Seislogs are presented in cross section format,
similar to a seismic section, but on a depth scale instead of
a time scale. Stratigraphic relationships are mapped
on the continuous log section, under the assumption that a given
horizontal lithologic unit maintains a constant velocity until
the lithology changes.
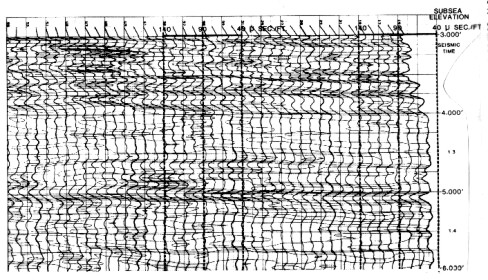
Inverted seismic section
This
assumption must be tempered by knowledge of gas zones and lithology
variations defined by log analysis. Depth plots of gamma ray,
density, sonic, and neutron logs, or computed lithology logs,
will be a great help in understanding a Seislog section.
Below, a number of velocity breaks have been contoured.
In normal use, the entire section is contoured. This procedure
lends itself readily to automation. The contours were machine drawn, illustrating the potential for automated stratigraphic
mapping. Individual lithological units can be outlined whenever
there is a small velocity contrast between adjacent units. While
the Seislog velocities may not match the borehole sonic velocities
exactly, the relative change in velocity from trace to trace is
normally quite reliable and very sensitive to changing lithology,
porosity, or fluid content.
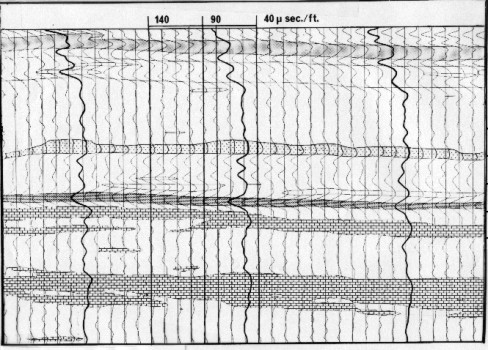
Seismic inversion section with interpreted lithology
based on velocity contours
Unfortunately,
several closely spaced contour lines can be confusing, making
it difficult to distinguish individual units. This can be remedied
by the addition of color coding, which relates velocity to estimated
rock type.
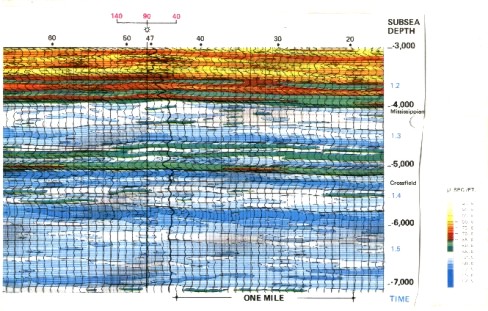
Contoured velocity mapping on a seismic inversion
In
general, the color scheme is grouped into three major division:
blue tones for the high velocities most commonly associated with
carbonates; yellow and orange tones for the intermediate velocities
most commonly associated with sandstones; and green tones for
the lower velocities commonly associated with shales. By custom,
as the velocity of sandstones and carbonates increases, the colors
become darker suggesting denser material and less porosity. At
the other end of the scale the darkest green colors correspond
to the lowest velocity, generally shales. In practice the interpreter
is given the option of varying the color scheme to fit known lithology
from logs and samples.
The
color code is strictly a function of velocity (or acoustic travel time) and
only indirectly indicates lithology. For instance, the green colors
above are somewhat ambiguous. Although they represent
shale in the Paleozoic section, they correspond to sandstones
having the same velocity in the Cretaceous. Such ambiguities must
be recognized and considered in the interpretation.
Good
log analysis results, plotted to the same vertical scale as the
inverted seismic section, will help calibrate lithology, porosity,
and fluid changes. Raw sonic, density, and gamma ray logs overlaid
on the Seislog would also be a tremendous help. It is surprising
how few presentations of this type are actually made, considering
that seismic inversion that is not calibrated to ground truth
is merely colorful, expensive wall paper.
|