|
 Case Histories: Vertical
Seismic Profiles
The literature is full of good examples of VSP success
stories. These are just a few that I like. Be sure to
correlate VSP results with logs and computed log results,
such as a lithology - porosity display.
 VSP in Faulted Section
Example shows VSP, dipmeter, and synthetic traces from sonic and
density logs. Note the clear evidence of a fault on the dipmeter,
which helps to explain why the log traces and VSP inversion do
not tie.
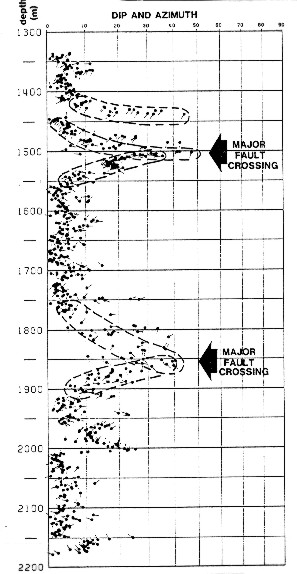
Dipmeter with fault
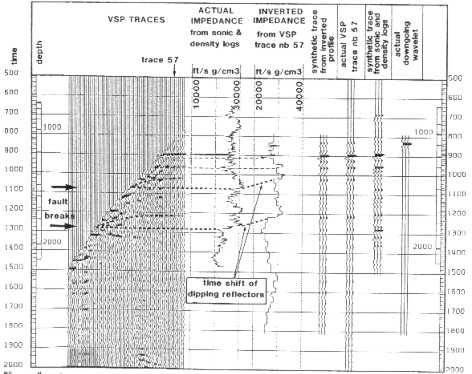
VSP, sonic, and inversion with fault
 VSP in Overpressured Section
Example shows seismic section and VSP overlay. Overpressure indications
on VSP inversion trace predict required mud weights and potential
drilling difficulty. Sonic and density trace from logs in final
hole confirm the presence of overpressure at the same depth as
the VSP prediction.
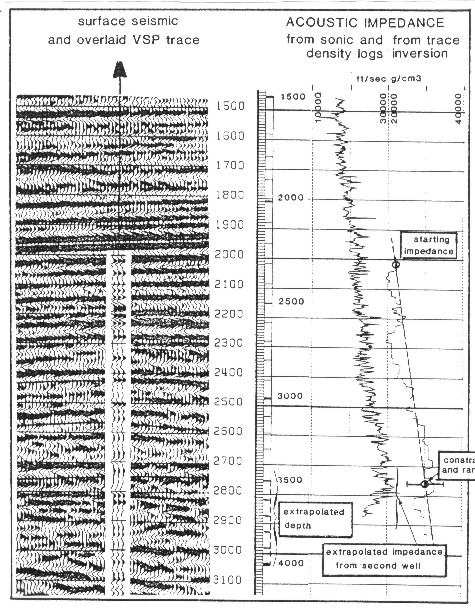
VSP used to predict top of overpressure zone
 VSP in Deviated and Horizontal Hole
Example shows original seismic section and VSP with time scale
gamma ray logs from two wells. Gamma ray defines sands of interest.
VSP shows major fault through sand. This fault and others are
drawn on a reprocessed, migrated seismic section, along with tracks
of development wells. Gamma ray profile on each well again defines
the sands. Finally a blowup of the seismic inversion section over
the sand shows track of horizontal hole. The wellbore track is
shown black where measurement while drilling gamma ray log indicated
shale and white for sands.
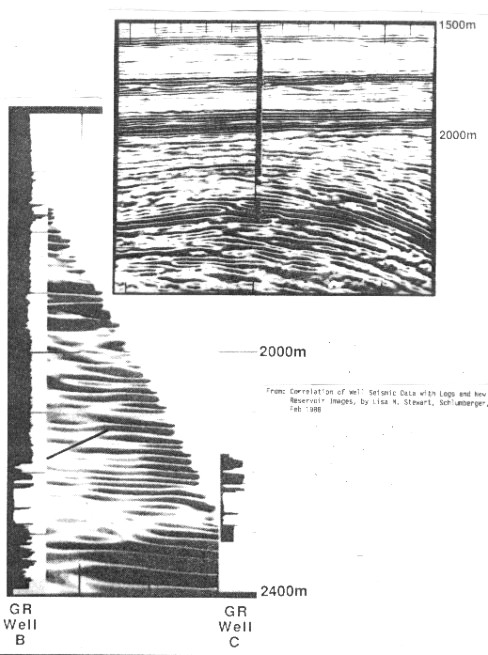
VSP with gamma ray logs
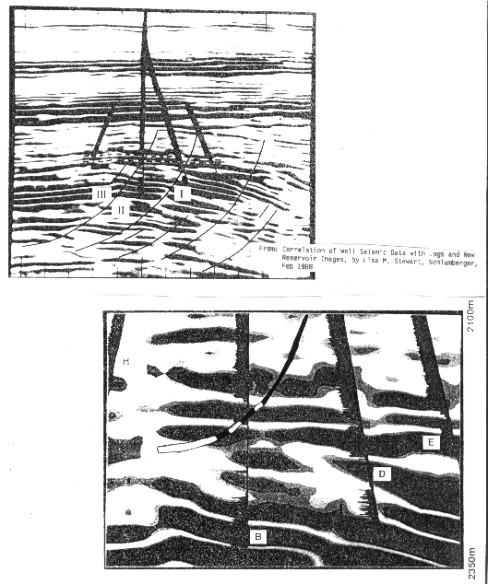
Inverted VSP with well tracks and GR logs
Compare the original seismic map with dome shaped, faulted interpretation
to the final map, which gives an entirely different picture of en-echelon faults.
Future drilling will be greatly influenced by this change in the
prospect orientation and shape.
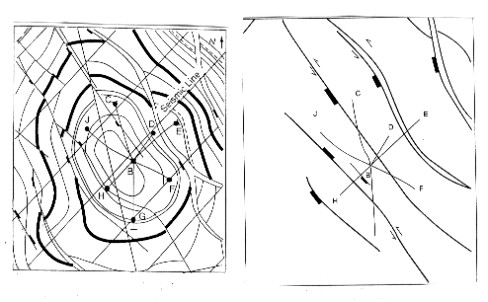
Original interpretation (left), new interpretation
(right)
|

