|
 Case Histories: Seismic Inversion
These
case histories show inversions based on acoustic impedance
or acoustic velocity. Many inversions can be made based on
other attributes, including elastic properties, such as
Poisson's Ratio, frequency content, and others.
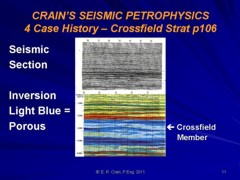
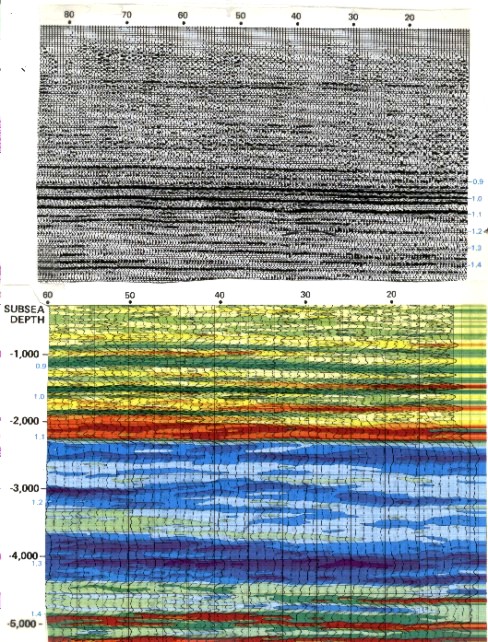
Devonian Crossfield Strat Trap
In this example, the lightest colors in the Crossfield member
at 1.4 seconds (-5200 ft) show where the porosity is highest.
The darker blue near shot point 39 corresponds to tighter rock,
which bounds this stratigraphic trap. Note that the correlation
lines do not always follow color boundaries. The horizon at the
top of the Devonian, for example, contacts variable color below
the line, corresponding to changes in Devonian facies at the contact.
Seismic Inversion on Mississippian strat trap
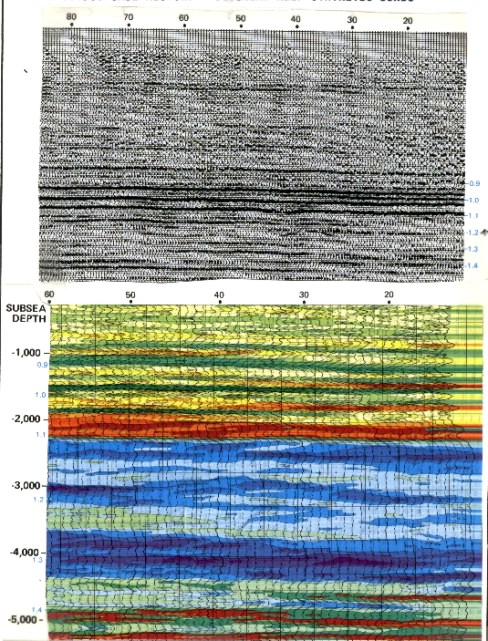
Devonian Reef Trap
The example shows a conventional seismic section with a portion
of a Seislog section across a Devonian reef. The Cretaceous Devonian
unconformity is at 1.1 seconds and the reef top at 1.2 seconds
near shotpoint 40. Drape over the reef is evident, as well as
a porosity halo around the reef, caused by secondary dolomitization.
Production is from the dolomite porosity.
Seismic inversion on a Devonian Reef
Reservoir Modeling
This example shows a schematic presentation of a seismic reservoir
model based on raw logs, processed seismic data, and a transform
of seismic amplitude to lithology and porosity. Such models are
really seismic inversions and are discussed more fully later in
this Chapter.
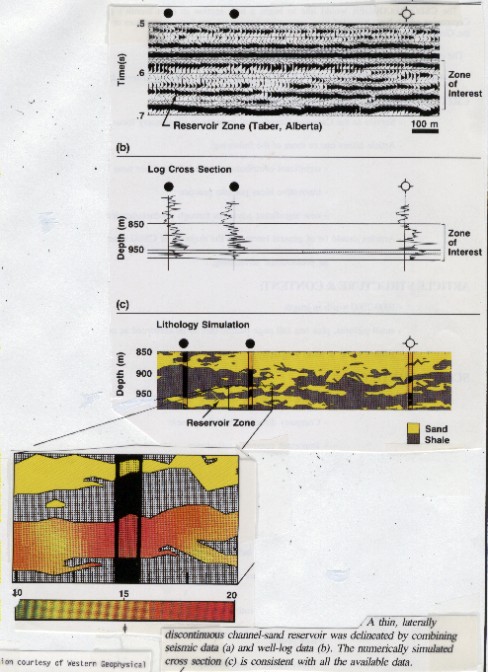
Lithology-porosity model in sand shale sequence
By
combining sonic log velocity and reservoir contours based on 3-D
migration of seismic, the porosity distribution of the pool can
be better defined. This permits nonlinear interpolation between
well control.
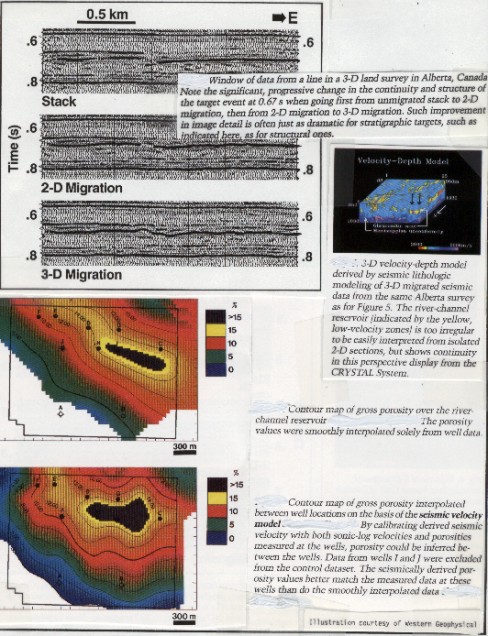
Velocity mapping to find porosity
The
penultimate example contrasts three modeling techniques
over a porous reef. At top is a seismic inversion which created
synthetic sonic logs from seismic traces. The colors represent
acoustic impedance, and hence lithology or porosity variations.
Sparse spike inversion, in the middle illustration, more closely
resembles a blocked sonic log, making it less noisy and easier
to interpret than normal inversion. Some fine detail may be lost.
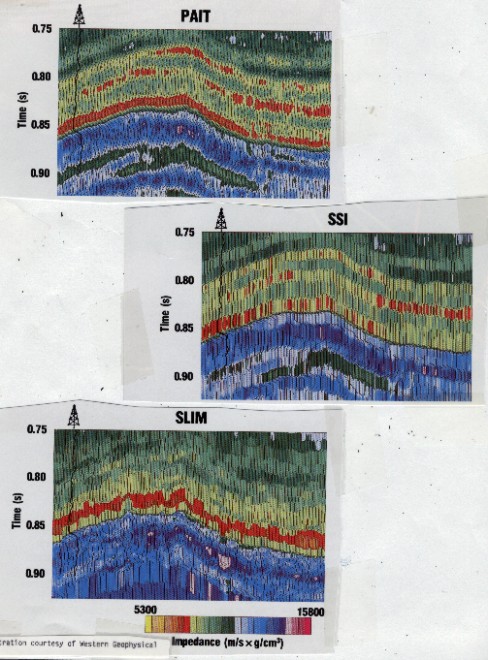
Inversion controlled by sonic log modeling
The
bottom image shows a multi trace forward model derived from interpolated
sonic logs. Such models are often used to control inversion processing
and interpretation. The model can be adjusted until a good fit
to the inversion is found, or some inversion parameters can be
adjusted until the inversion becomes more realistic. Both models
can be altered under user control and viewed on a workstation.
Potash Mining
The final example illustrates synthetics made from sonic logs
over a potash-halite-anhydrite sequence in Saskatchewan. Because
the density variations between these minerals is so extreme, the
synthetics would have been much more realistic if this data had
been included. (Density sylvite = 1.86 gm/cc, carnallite = 1.57
gm/cc, halite = 2.03 gm/cc, anhydrite = 2.97 gm/cc, dolomite 2.87
gm/cc, limestone 2.71 gm/cc). The density contrast is larger than
the velocity contrast and is an important factor in matching to
real seismic.
Synthetic seismograms in potash beds
Synthetic seismograms in potash beds with mine
entry edited into sonic log
Synthetic seismograms in potash beds compared
to real seismic
This
example courtesy of Boyd Geosearch, Calgary.
|