|
 POROSITY BASICS
There are many petrophysical models for
calculating poroosity from well logs. For a summary, see
Crain's Usage Rules for Selecting
Porosity Methods.
Porosity is the volume of the non-solid portion of the rock filled
with fluids, divided by the total volume of the rock. Primary porosity is the porosity developed by the original sedimentation
process by which the rock was created. In reports, it is often
referred to in terms of percentages, while in calculations it
is always a decimal fraction.
Secondary porosity is created by processes other than primary
cementation and compaction of the sediments. An example of secondary
porosity can be found in the solution of limestone or dolomite
by ground waters, a process which creates vugs or caverns. Fracturing
also creates secondary porosity. Dolomitization results in the
shrinking of solid rock volume as the material transforms from
calcite to dolomite, giving a corresponding increase in porosity.
Log
analysts define porosity somewhat differently, due to the nature of
the measuring techniques. These definitions are described later in
this Chapter.
POROSITY IN SANDSTONES
We tend to think of sandstones as being composed of
quartz grains, but this is a false impression based on too many
idealized cinematic beaches and cast-away island songs. Most
sandstones are made of many different minerals; some have no quartz
at all. So in the following discussion, please think of sand grains
as being composed of a variety of minerals, not necessarily pure
quartz.
To acquire an appreciation for the values of porosity generally
encountered, assume round balls of the same size are stacked on
top of each other in columns. Calculations will show a porosity
of 47.6%. Spherical sand grains 1/10 the size of the balls stacked
one on top of the other will have the same porosity, 47.6%.
If the same balls are packed in the closest possible arrangement
in which the upper ball sits in the valley between the four lower
balls, the porosity is reduced to 25.9%. Again,
changing the size of the balls will not change the porosity as
long as all the balls are the same size.
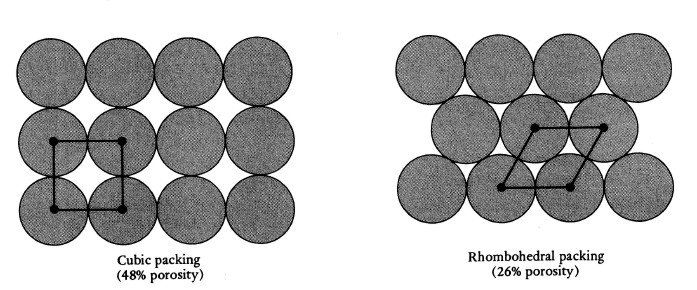
Cubic packing 47% porosity (left) Rhombic packing 26%
porosity (right)
Mixing the sizes of the balls will create lower
porosity, since small ones can fit in spaces created between the
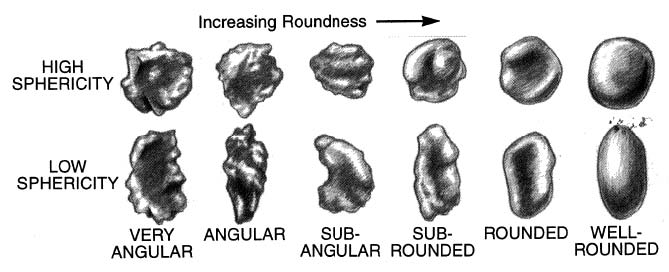
larger ones. The term "sorting" is used to describe the distribution
of grain sizes in a sandstone. Very well sorted rocks have fairly
uniform grain size and high porosity. Poorly sorted sands have a
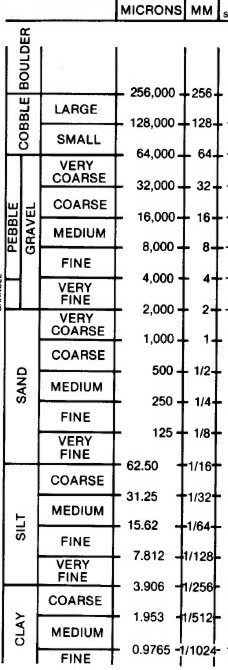
wide range of grain size and poor porosity, illustrated below. Grain
size classifications are shown on the scale at right, below.
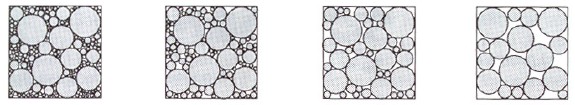
Poorly Sorted
Moderately Sorted
Well Sorted
Very Well Sorted
Low Porosity
Poor Porosity
Good Porosity
Excellent Porosity
  The highest porosity
normally anticipated is 47.6%. A more probable
porosity is in the mid-twenties. The normal range of porosities
in granular systems is 5% to 35%. The highest porosity
normally anticipated is 47.6%. A more probable
porosity is in the mid-twenties. The normal range of porosities
in granular systems is 5% to 35%.
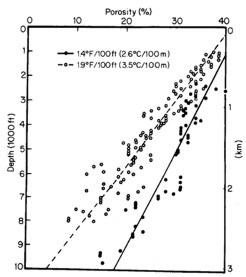
In general, porosities tend to be lower in deeper and older rocks.
This decrease in porosity is primarily due to overburden
stresses on the rock, and cementation. There are many exceptions
to this general trend, when normal overburden conditions do not
prevail.
Shales closely follow the same porosity depth trend as
sandstones. For example,
in a recent mud the porosity may measure about 40%. It decreases
rapidly with depth and overburden pressure until, at a depth of
about 10,000 feet, normal porosities are less than 5%. Shales
are plastic and therefore, compress more easily than sands.
These basic trends of porosity versus depth are not as noticeable
in carbonates, where porosity is more a function of depositional
environment and secondary processes, both unrelated to depth of
burial.
Porosity in a real shale is not effective; that is, the water cannot
move as quickly as in a sandstone with the same apparent porosity.
Water in shale can be expelled over large geologic time periods,
but it will not flow in the usual sense of the word.
However, many
intervals that have been traditionally thought of as "shale" are
really silty shales or sandy shales. These may have sufficient
porosity to store hydrocarbons that might flow. This is especially
true for gas, and many "gas shales" are silty shales with effective
porosity. Other gas shales are mostly shale and gas is stored on the
surface of kerogen within the shale. This is adsorbed gas.
Laminated shaly sands are also called gas shales in some literature.
While they are definitely shaly and contain gas, the petrophysical
model is quite different from gas shales or gas silts, so the
"laminated" adjective should be retained.
Porosity in shaly
sands varies with the amount and distribution of the clay minerals
within the sandstone. The common distributions and their effect on
porosity are shown below.
The Effect of Clay distribution on Porosity in a Shaly Sand.
Sand grains are yellow, effective
porosity is blue, and clay (including clay bound water) is coloured black.
For log analysis
purposes, we define total porosity as the pore space (blue area in
above illustration) plus the clay bound water (part of the black
shading). Effective porosity is defined as the total porosity minus
the clay bound water (blue area only). Further adjustments are
sometimes made to generate useful or connected porosity, which
excludes clay bound water and any unconnected pores, such as
pin-point vugs or isolated pores inside the sand grains.
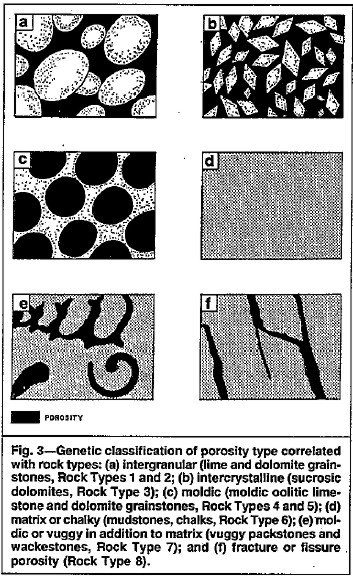
POROSITY IN CARBONATES
Porosity in
carbonates is more complicated than in sandstones, partly due to
various classification methods and more combinations of carbonate
fabric and associated porosity. Most of the porosity that is useful
in carbonate reservoirs is secondary porosity, formed after
deposition.
The use of the term, Secondary Porosity Index (SPI) by log analysts
has led to much confusion. The term means the porosity defined
by the difference between porosity derived from the sonic log
and the primary porosity. The primary porosity is usually defined
by core analysis or the density neutron log. Depending on the
shape and size of the vugs, fractures, or caverns, the SPI may
or may not be a good indication of secondary porosity.
Below
are three different classification methods for carbonate porosity.
Sample descriptions of the same rock will vary, depending on the
wellsite geologist's age, training, and current knowledge of the
geological literature. Dunham's method is the oldest and simplest,
followed by Choquette's method, then by Lucia's, which is by far the
most complex but most complete.
Porosity classifications vary according to the authority cited -
this is Choquette's system
and is widely used.
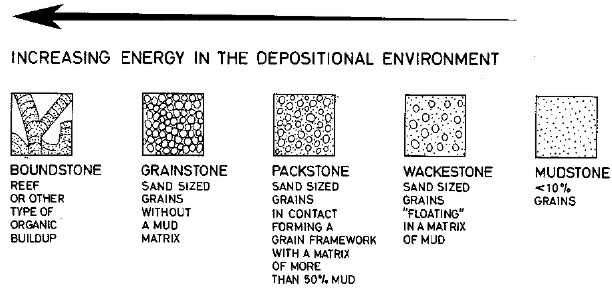
Dunham's classification of carbonate textures - these are
independent of the porosity classification
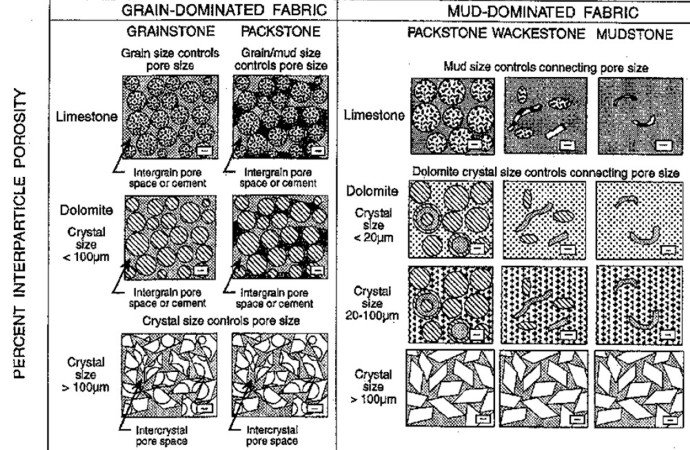
Lucia's classification of carbonates, expanding Dunham's
classification to include porosity type
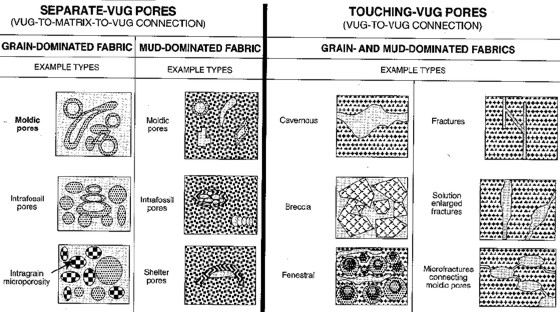
Lucia's classification extended to
cover connected and unconnected vuggy porosity types
Useful Porosity
There is a recent trend among petrophysicists and engineers to
partition porosity into a useful and a non-useful fraction. The
concept of useful porosity, as opposed to effective porosity,
is helpful where very small pores exist. These tiny pores do not
connect to other pores and thus do not contribute to useful reservoir
volume or reservoir energy. They are invariably water filled and
nothing flows from them or through them. The tiny pores are called
micro porosity; the larger, more effective, pores are called macro
porosity. Personally, I prefer the term connected and
unconnected (or poorly connected) porosity, as illustrated
below:
Porosity definitions related to
useful or connected porosity. Some micro porosity may not be
observed in conventional core analysis. Most porosity indicating
logs see unconnected porosity, but the sonic log may not see any or
all of the microporosity.
Thus:
1: PHIuse = PHIe - PHImicro
In sandstones, micro porosity is often associated with
intraparticle porosity in volcanic
rock fragments and kaolinite that are part of the sandstone mineral mixture.
In carbonates, micro porosity is associated with micrite, matrix,
fossil skeletons, or pin point vugs. Larger vugs are often
connected.
The quantity of micro porosity cannot always be found directly
from logs but is usually assessed as a constant fraction, KM1,
of the effective porosity. This constant can be found by examination
of thin section visual porosity. Where micro porosity is associated
with silt or a volcanic mineral (Vmin2) in a quartz sandstone:
2: KM1 = Vsilt / (Vqrtz + Vsilt)
OR 2A: KM1 = Vmin2 / (Vqrtz + Vmin2)
3: PHIuse = PHIe * KM1
In some cases, the micro porosity is assumed to be a constant
value instead of a constant fraction of the silt volume, PHIoffset, over an interval (ie, PHImicro is not proportional
to effective porosity). This appears to happen in carbonates with
unconnected pinpoint vugs (PHIppv), micritic carbonates (PHImict),
or carbonates with matrix porosity (PHImatr). In all three cases,
PHIoffset is found by comparing visual porosity in thin sections
to log analysis porosity.
4: PHIuse = PHIe - PHIoffset
In log analysis terminology, matrix porosity usually means effective
porosity (PHIe). However, in petrographic (thin section) analysis,
matrix porosity (PHImatr) is non-useful porosity contained in
the very fine-grained matrix material deposited between the granular
or crystalline rock structure.
PHIppv, PHImict, and PHImatr may be varied according to rules
developed by the analyst for the zone. A crossplot of visual porosity
from thin section analysis versus PHIe from logs is a useful tool
for determining the appropriate correction to obtain PHIuse. Typical
rules might be:
5: PHIuse = PHIe - PHIsec
6: PHIuse = PHIsec
7: PHIuse = PHIe - KMATR * (1 - PHIe) / (1 - KMATR)
8: PHIuse = PHIe - PHIsc * KMICT / PHISavg
KMATR and KMICT would be in the range 0.01 to 0.08, averaging
0.04, and cannot exceed PHIt.
Definitions
of Porosity FOR LOG ANALYSIS PURPOSES
The above discussion covers the geological definitions of porosity.
Petrophysicists, log analysts, and engineers use more specific
terms based on the concept of total and effective porosity. Here are the definitions:
|
DFN
1: |
The
formation rock/fluid model is comprised of: |
| |
-
the matrix rock (Vrock) |
| |
-
the pore space (or porosity) within the matrix rock (PHIe) |
| |
-
the shale content of the matrix rock (Vsh) |
| |
|
| By
definition, Vrock + PHIe + Vsh = 1.00 |
| |
|
|
DFN
2: |
The
matrix rock component (Veock) can be subdivided into two or
more constituents |
| |
(Vmin1,
Vmin2, ...
), such as: |
| |
-
limestone, dolomite, and anhydrite or |
| |
-
quartz, calcite cement, and glauconite |
| |
|
| The
mineral mixture can be quite complex and log analysis may
not resolve all constituents. |
| |
|
|
DFN
3: |
The
shale component (Vsh) can be classified further into: |
| |
-
one or more clays (Vcl1, Vcl2, … ) |
| |
-
silt (Vsilt) |
| |
-
water trapped into the shale matrix due to lack of sufficient
permeability to allow the water to escape |
| |
-
water locked onto the surface of the clay minerals |
| |
-
water absorbed chemically into the molecules of the clay minerals |
| |
|
| The
sum of the three water volumes is called clay bound water
(CBW). CBW varies with shale volume and is zero when Vsh =
0. |
| |
|
| By
definition, Vsh = Vcl + Vsilt + CBW |
| |
|
|
DFN
4: |
Bulk
volume water of shale (BVWSH) is the sum of the three water
volumes listed |
| |
above
in the definition of shale and is determined in a zone that
is considered to be |
| |
100%
shale.
|
| |
|
| By
Definition, CBW = BVWSH * Vsh |
| |
|
|
DFN
5: |
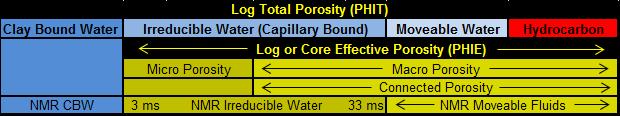
Total
porosity (PHIt) is the sum of: |
| |
-
clay bound water (CBW) |
| |
-
free water, including irreducible water (BVW) |
| |
-
hydrocarbon (BVH) |
| |
|
| Some
of the “free water” is not free to move - it is,
however, not “bound” to the shale. It could also
be called pore water. |
| |
|
|
DFN
6: |
Effective
porosity (PHIe) is the sum of: |
| |
-
free water, including irreducible water (BVW) |
| |
-
hydrocarbon (BVH) |
| |
|
|
DFN
7: |
Effective
porosity is the porosity of the reservoir rock, excluding
clay bound water |
| |
(CBW).
|
| |
PHIe
= PHIt - CBW |
| |
OR
PHIe = PHIt - Vsh * BVWSH |
| |
|
|
DFN
8: |
Free
water (BVW) is further subdivided into: |
| |
-
a mobile portion free to flow out of the reservoir (BVWm) |
| |
-
an immobile or irreducible water volume bound to the matrix
rock by surface tension (BVI or BVWir) |
| |
|
| BVI
is sometimes called “bound water” or "capillary
bound water", but this is confusing (see definition of
clay bound water above), so “irreducible water”
is a better term. |
| |
|
|
DFN
9: |
Hydrocarbon
volume (BVH) can be classified into: |
| |
-
mobile hydrocarbon (BVHm) |
| |
-
residual hydrocarbon (BVHr) |
| |
|
|
DFN
10: |
Free
fluid index (FFI) is the sum of BVWm, BVHm, and BVHr. It is
also called moveable |
| |
fluid
(BVM)
or useful porosity (PHIuse).
|
| |
PHIuse
= BVM = FFI = BVWm + BVHm + BVHr |
| OR |
PHIuse
= PHIe - BVI |
| OR |
PHIuse
= PHIe * (1 - SWir) |
| |
|
| This
definition is needed for older nuclear magnetic logs since
they could not see BVWir. |
Non-useful
porosity occurs as tiny pores that do not connect to any other
pores. They are almost invariably filled with immoveable water
and do not contribute to useful reservoir volume or energy. Such
pores occur in silt, volcanic rock fragments in sandstones, and
in micritic, vuggy, or skeletal carbonates. The NMR may see some
of this non-useful porosity; the jury is still out.
POROSITY INDICATING LOGS
 There
are numerous porosity indicating logs, as shown in the box at
right, and many flavours of each, depending on the age, design,
and logging environment. Generic analysis equations, based on
the Log Response Equation, for each basic tool type are contained
in this Chapter. They will work for almost all available tool
types. There may be rare occasions when a customized analysis
model might be required. There
are numerous porosity indicating logs, as shown in the box at
right, and many flavours of each, depending on the age, design,
and logging environment. Generic analysis equations, based on
the Log Response Equation, for each basic tool type are contained
in this Chapter. They will work for almost all available tool
types. There may be rare occasions when a customized analysis
model might be required.
All the porosity models require some assumptions about such things
as fluid type and matrix rock properties. With the exception of
the resistivity log formula, used for analysis of ancient logs,
the methods involve corrections for the effects of shale.
Various methods are presented in other sections of this Handbook to calculate porosity from
individual or combinations of two or more logs. Two-log combinations
are termed crossplot methods, since the log data can be plotted
on the X and Y axes of a graph.
Three or more log combinations require solution by simultaneous
equations, and are usually done on a computer.
Shale corrections are applied to porosity logs to determine effective
porosity. Since shale contains some water, this water must be
subtracted from the total porosity as measured by conventional
logging tools. The mathematical method for finding shale volume
is the same for all the shale distribution types, but the method
for applying the shale correction to the porosity varies.
Correcting for shale is only half the battle. The other half is
to correct for the mineral composition of the rocks. In most carbonate
reservoirs, the lithology is usually reasonably well known from
sample descriptions or can be determined from log response, so
this step is relatively straightforward.
This is not true in sandstones because the mineral makeup of the
sand is NOT usually described in much detail. There is a universal
trend to give sandstones the physical properties of pure quartz,
but this is almost universally NOT appropriate. Most sandstones
contain other minerals besides quartz, such as mica, volcanic rock fragments,
calcite, dolomite, anhydrite, and ferrous minerals, as well as
the shale and clay described above. All of these minerals have
different log responses than quartz.
If a sandstone is assumed to be pure quartz when it is not, the
commonly used properties of quartz will provide a pessimistic
porosity answer.
Thus, authors and service company manuals that present quartz
properties for “sandstone” are misleading their audience
into believing these properties are constant. In more than 40
years of petrophysical analysis, I have never seen a thin section
or XRD report that gave an assay of 100% quartz in any petroleum
reservoir. A 100% quartz sand is very rare. If anyone doubts this
statement, look at the PEF curve. If it reads more than 1.8, you
have “quartz plus other things” in your sandstone.
There is a story (it may even be true) that reserves for the early
North Sea discoveries were seriously underestimated because the
mica in the sands was not accounted for properly. The engineers
used density log porosity without correcting for the real matrix
density. If true, good engineering practice would have undersized
all the offshore equipment and early cash flow and rate of return
on investment would have been significantly reduced. If the myth
that sandstone is pure quartz is perpetuated, there will be more
economic blunders of this type.
To further confuse the uninitiated, many logs show data on a "porosity"
scale. These log curves are transforms of some measured physical
property to an approximate porosity based on some arbitrary parameters.
Examples are density, neutron, or sonic porosity on so-called
Sandstone, Limestone, or Dolomite porosity scales. Porosity as
defined by these transforms is only directly useful if there is
no shale, the scale matches the rock mineralogy. and there are
no accessory minerals. Real reservoirs are rarely this simple.
DO NOT use these porosity transforms without further analysis
unless all the arbitrary assumptions used to create them match
exactly the rock you are analyzing.
Some people call these porosity curves an “interpretation”.
They are not. They are merely a transform of the raw data to a
more attractive scale. The difference between a transform and
an interpretation is critical. Interpretation infers some intelligent
thought went into creating and understanding the result. The service
company running the log does not provide interpretations. YOU
are the interpreter,
There are endless cases where a transform to an inappropriate
porosity scale has caused millions in losses due to poorly informed
analysts who see “gas cross over” when there is no
gas, or who read porosity directly from the transform and either
seriously over estimate or under estimate reservoir effective
porosity.
In spite of these comments, a number of charts and tables in this
Handbook show the word "sandstone'
when they really should say "quartz". I have not edited
the charts and tables taken from common sources, such as service
company chart books, so the common usage of incorrect terminology
is repeated even here.
|