|
 PROPAGATION
and DIELECTRIC
LOG BASICS
PROPAGATION
and DIELECTRIC
LOG BASICS
Two classes of tools are available for measuring the
formation dielectric constant. The first one is
low-frequency dielectric constant logging tools using coils
on a mandrel, and more recently on a sidewall skid. They
operate in the 50 to 200 megahertz range. The second type is
high-frequency, 200 MHz to 1.1 GHz, using microwave antennae
on a pad contact device.
The first type were known as dielectric logs (DLT). The high
frequency tools became known as electromagnetic propagation (EPT)
logs. Modern versions of both types that operate at multiple
frequencies are called array dielectric tools. The
Schlumberger tool scans 4 frequencies between 20 MHz and 1
GHz. The Baker tool covers 47 to 200 MHz.
EPT logs measure propagation time (TPLP and signal
attenuation (ATTEN). Both are strongly affected by water so
water filled porosity can be calculated from these values.
As a 1 GHz tool, depth of investigation was very shallow. In heavy oil, where invasion is shallow, this water volume
is close to the irreducible water. PHIept = PHIe only in
water zones.
On low frequency DLT tools, curves presented varied
considerably but might include attenuation, phase shift, relative dielectric
permittivity, or resistivity. The advantage of
the DLT propagation log is that the lower frequency permits
a larger depth of investigation and therefore an analysis of
the undisturbed zone may be more likely.
Newer array dielectric logs measure at 4 different
frequencies, giving a resistivity profile at 4 depths of
investigation. They also measure signal phase shift, which
can be transformed into water filled porosity and presented
on the log.
All these tools can be used to estimate invaded zone water
saturation Sxo = PHIept / PHIt. Under the right conditions
(shallow invasion, reasonably deep investigation) the Sxo
may approach the undisturbed zone water saturation SWept.
The measurement is relatively independent of water salinity
at salinities above 10,000 ppm NaCl so it is a helpful guide
to spotting hydrocarbons in fresh water environments.
Its major use is in heavy oil wells, such as those in
California and western Canada, and in EOR projects where
water, CO2, and chemical floods have confused the original
water resistivity regime.
Reference:
1. Electromagnetic Propagation - A New Dimension In Logging
T.J. Calvert, R.N. Rau, L.E. Wells,
AIME, 1977
POROSITY and SATURATION FROM Electromagnetic PROPAGATION
LOG
 Simplified log analysis of EPT is based on a time average
equation similar to the sonic log Wyllie equations: Simplified log analysis of EPT is based on a time average
equation similar to the sonic log Wyllie equations:
1: TPo = (TPL^2 - ATTN^2 / 3604)^0.5
2. PHIept = (TPo - (1 - Vsh) * TPma - Vsh * TPsh)
/ (TPw - TPma)
CAUTION: The porosity (PHIept)
derived from these logs is the water filled porosity. This is
the flushed or invaded zone water content which is not total or
effective porosity, except in water zones.
Where:
ATTEN = EPT attenuation (db/m)
TPL = EPT log reading (nsec/m)
TPma = EPT matrix value (nsec/m)
TPw = EPT water value (nsec/m)
TPsh = EPT shale value (nsec/m)
In conventional oil and gas:
3: Sxo = PHIept / PHIe
If shale corrections were ignored:
4: Sxo = PHIept / PHIt
In very heavy oil, tar, or bitumen, where invasion is
minimal:
5: Sw = PHIept / PHIe
OR 6: Sw = PHIept / PHIt if shale corrections were ignored in
finding PHIept.
 Depth plots of both PHIept and PHIe are commonly shaded to
show the difference, which is the hydrocarbon volume. This
difference is helpful in locating hydrocarbons and oil water
contacts in conventional oil, and may be close to actual
hydrocarbon volume in heavier oils. Depth plots of both PHIept and PHIe are commonly shaded to
show the difference, which is the hydrocarbon volume. This
difference is helpful in locating hydrocarbons and oil water
contacts in conventional oil, and may be close to actual
hydrocarbon volume in heavier oils.
Charts are available to correct ATTEN and TPL for spreading,
salinity, and temperature. Some computer software ignores the
shale correct so you get water filled porosity plus clay bound
water instead of just water filled porosity.
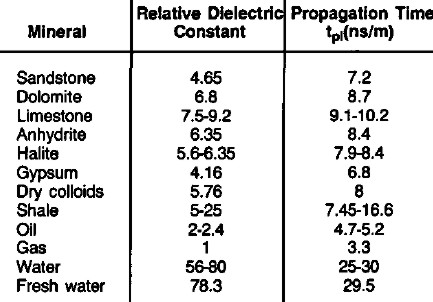
The EPT method is somewhat insensitive to water salinity and
matrix properties as both terms have relatively narrow ranges (TPma
~~ 8 and TPw ~~ 70). It is especially useful in fresh water oil
or gas reservoirs, where resistivity methods lack sufficient
resolution to detect hydrocarbons easily.
More
elaborate methods to solve for water filled porosity are encoded
in commercial software, using the real and imaginary (phase and
amplitude) information buried in the electromagnetic signal. The
CRIM and CTA methods are documented in Schlumberger's "Log
Interpretation Principals and Applications" manual. The
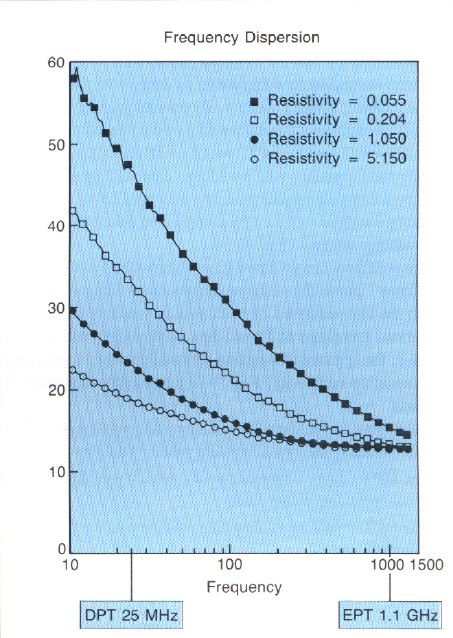
dielectric constant of materials varies with the electromagnetic
frequency of the logging tool, so these more exotic methods are
required with dielectric (low frequency) logs, since propagation
time is not recorded on these logs.
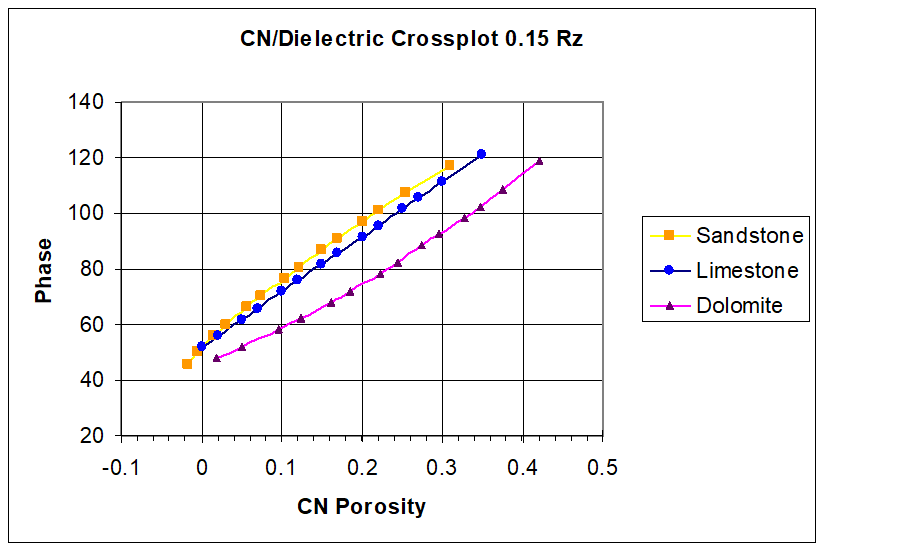
Porosity and Water Saturation From Dielectric Phase Shift
Modern dielectric logs measure both resistivity and phase shift
between transmitted and received EM signals. The phase shift (PHZ)
varies with the volume of each mineral and fluid in the formation.
Like sonic travel time and density, the measured log value is the
sum of these volumetric contributions.
These tools have relatively shallow depth of investigation so in
conventional oil and gas they measure values in the flushed or
invaded zone. In heavy oil and tar sands, invasion can be quite
shallow, so the resistivity and phase shift usually represent the
undisturbed zone. These comments must be considered in the choice of
the fluid phase shift (PHZfl), as the values for water and
hydrocarbon differ by a factor of 10 or more.
Dielectric Phase Responses Equation – 200 MHz Tools
1. PHZfl = SW * PHZw + (1 – SW) * PHZhy
2. PHZma = SUM (Vmin1 * PHZmin1 + Vmin2 * PHZmin2 + ….)
3. PHZ = (1 – PHIe - Vsh) * PHZma + PHIe * PHZfl + Vsh * PHZsh
The above equation is often published without the shale term, but
there is no reason to ignore the shale correction.
Where:
PHZ = phase shift reading from log
PHZfl = phase shift of fluid mixture in zone penetrated by EM
signal
PHZma = phase shift of rock matrix
PHZsh = phase shift of shale
PHZw = phase shift of water
PHZhy = phase shift of hydrocarbon
SW = water saturation (may be anywhere between flushed to
undisturbed zone SW)
 Dielectric Phase Shift Parameters Dielectric Phase Shift Parameters
Degrees Default
Gas 18 – 20 18
Oil 20 – 30 25
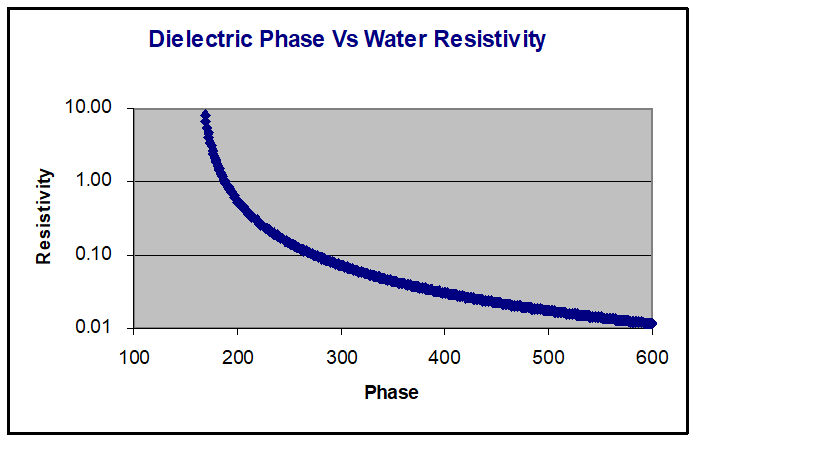
Water 60 – 450 250 See Graph
==>
Quartz 42 – 46 46
Dolomite 48 – 50 48
Limestone 50 – 52 52
Shale 45 – 65 55
Solving the response equation for water filled porosity, we get:
4. PHIphz = (PHZ – PHZma) / (PHZw – PHZma)
5. SXOphz = PHIphz / PHIt
CAUTION: The porosity (PHIphz)
derived from these logs is the water filled porosity. This is the
flushed or invaded zone water content which is not total or
effective porosity, except in water zones.
Where:
PHIphz = porosity from dielectric phase shift
Rept = resistivity from deep dielectric log
SXOphz = invaded zone water saturation
PHIt = total porosity from conventional log analysis
NOTE: The service company will display a porosity derived from phase
shift on the log. However, this will be based on default parameters.
You may need to recompute with the fluid, matrix, and shale
properties based on actual lithology.
TEXTURAL PARAMETER "W" From Dielectric Phase Shift
Traditionally, the Archie parameters M and N are assumed or
determined in the laboratory. The former method is prone to error
and the latter may be impossible due to no core samples or results
arrive too late to be useful. An alternate textural parameter,
dubbed W by Baker Hughes and MN by Schlumberger, can be derived from
the dielectric porosity and resistivity.
6. W = log (Rmf / Rxo) / log (PHIphz)
Using the Archie equation:
7. SWphz = ((RW / RESD) / PHIt^W)) ^ (1/W)
Where:
SWphz = water saturation using M = N = W
The above assumes M = N = W. Since W cam be calculated continuously
over an interval, it can be helpful in refining SW in carbonates
with varying pore geometry. In unconventional reservoirs where M and
N are considerably less than 2.0, it may help to set N = W and M =
0.8 * W.
RESD may be from conventional array induction or from deepest
dielectric resistivity if invasion is shallow enough. This log has
excellent bed resolution, so it is worth trying to use porosity and
resistivity from it if possible.
Porosity CROSSPLOTS FoR Dielectric LOG
These crossplots, courtesy of Baker Hughes, show dielectric phase
porosity on a limestone scale versus other porosity tools.
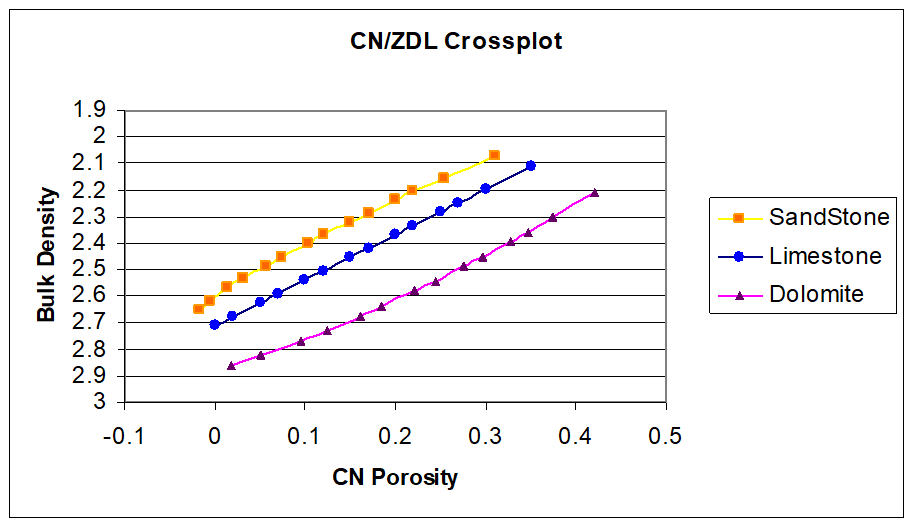
Conventional density vs neutron crossplot (left) compared to
dielectric phase shift vs neutron crossplot (right)
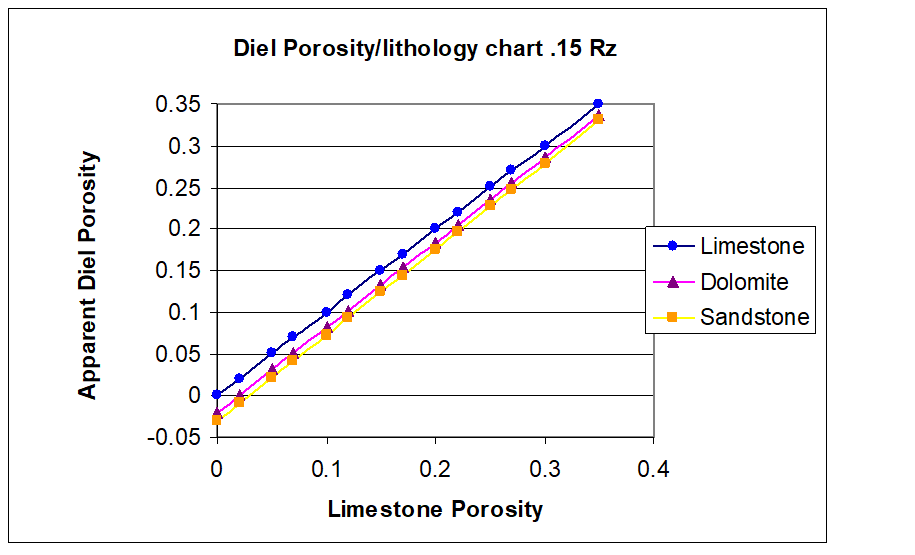
Lithology effects on phase porosity are minor.
|