|
 Calculating Net Pay with
Cutoffs
Calculating Net Pay with
Cutoffs
"Net Pay" is
defined as the thickness of rock that contributes to
economically viable production with today's technology,
today's prices, and today's costs. Net pay is obviously a
moving target since technology, prices, and costs vary
almost daily. Tight reservoirs or shaly zones that were
bypassed in the past are now prospective pay zones due to
new technology and continued demand for hydrocarbons.
We determine net pay by applying appropriate cutoffs to
reservoir properties so that unproductive or uneconomic
layers are not counted. This can be done with both log and
core data.
Routine, or
conventional, core analysis data can be summed and averaged to
obtain mappable reservoir properties, just like log analysis
results. These mappable properties are also used to compare log
analysis results to core data. If the mappable properties do not
match over the same rock interval, some adjustments must be made to
the log analysis. Be sure to depth match the core to the logs first,
and take into account macro and micro fractures that the logs cannot
see. Laminated reservoirs may cause point by point differences but
the average values of log and core properties should be similar.
Cumulative reservoir properties, after appropriate cut offs are
applied, provide information about the pore volume (PV), hydrocarbon
pore volume (HPV), and flow capacity (KH) of a potential pay zone.
These values are used to calculate hydrocarbon in place, recoverable
reserves, and productivity of wells. The following algorithm is
a highly simplified one pass approach, which would need considerable
adjustment to run on a real computer. However it is suitable for
discussion purposes.
Pay Flag Calculation
- Simple Model
It is normal to apply cutoffs to each calculated
result to eliminate poor quality or unproductive zones. Cutoffs
are usually applied to shale volume, porosity, water saturation,
and permeability. The layer is not counted as “pay” if it fails
any one of the four cutoffs.
Typical cutoffs are:
1: IF (Vsh <= VSHmax)
* (PHIe >= PHImin) * (Sw <= SWmax) * (Perm >= PERMmin)
= 1
2: THEN PAYFLAG = 1
3: ELSE PAYFLAG = 0
4: Hnet = SUM (PAYFLAG * INCR)
Where:
Hnet = Net Pay
INCR = digitizing increment
Perm = permeability (md)
PERMmin = permeability cutoff (md)
PHImin = porosity cutoff (fractional)
PHIe = effective porosity (fractional)
Sw = water saturation (fractional)
SWmax = saturation cutoff (fractional)
Vsh = volume of shale (fractional)
VSHmax = shale volume cutoff (fractional)
Typically:
VSHmax =
0.25 to 0.45
PHImin = 0.03
to 0.16
SWmax = 0.30
to 0.70
PERMmin = 0.01
to 5.0 mD
These values must be appropriate for the
rock sequence. Values in unconventional reservoirs may be more
extreme.
In
reservoir simulation work, the Net Reservoir is also needed. In
this case, set SWmax = 1.00. The result of equations 1 to 4 for
this case is Hres instead of Hnet.
To map Net Sand, set PHImin = 0.0
and SWmax = 1.0. The result of equations 1 to 4 for this case is
Hsnd instead of Hnet.
Some
people are interested in "Net to Gross Ratio" but they have to be
specific as to whether they mean:
5: Gross = ZONE_BOTTOM - ZONE_TOP
6: NetPayToGross = Hnet / Gross
7: NetResToGross = Hres / Gross
8: NetSndToGross = Hsnd / Gross
COMMENTS:
The pay flag may be very sensitive to small changes in cutoffs.
Any one of the four primary cutoffs can create a "FAIL"
situation. This is enough to fail the layer even if other cutoffs
do not fail the zone. The
Some
cutoffs may be set high enough or low enough so as not to be effective.
For example, if PERMmin = 0, then no value of Perm could be less
than PERMmin, so permeability could not fail to pass a layer.
More
than one set of cutoffs are normally run and the results compared
to find the set that appears to give reasonable results when compared
to production profiles in the area.
Since porosity is somewhat proportional to shale
volume, saturation somewhat proportional to porosity, and
permeability somewhat proportional to all three, it is desirable
to choose a balanced set of cutoffs. Balanced cutoffs in a
hydrocarbon bearing zone usually will fail a layer with more
than one cutoff. If only one cutoff fails a layer, the cutoffs
may need some adjustment.
Cutoffs can be tested against production
flowmeter data and can be tuned, in some cases, based on actual
production rates
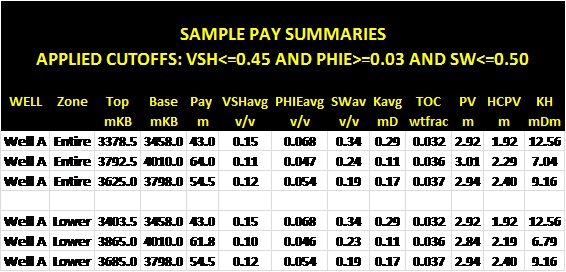
Sample net pay table with average
and cumulative mapable properties based on a typical set of cutoffs
appropriate for a low porosity tight gas interval.
Pay Flag Calculation
- Descriptive Model
Each
layer is tested against a series of cutoffs to determine if the
layer can contribute to production from the well. Each test must
be run in the order shown below so that the correct description of
the layer can obtained:
1: IF PHIe < PHImim THEN PAYFLAG$ = "TIGHT"
2: OR IF Sw > SWmax THEN PAYFLAG$ = "WET"
3: OR IF Perm < PERMmin THEN PAYFLAG$ = "LOWPERM"
4: OR IF Vsh > VSHmax THEN PAYFLAG$ = "SHALY"
5: OTHERWISE PAYFLAG$ = "PAYZONE"
6: IF PHIdc >= PHInc + TOLER THEN PRODFLAG$ = "GAS"
6: IF PHIdc < PHInc + TOLER THEN PRODFLAG$ = "OIL"
7: IF PHIe * Sw > PHIxSWmax THEN PRODFLAG$ = "H2O"
8: Hnet = SUM (PAYFLAG$ = "PAYZONE" * INCR)
Sonic neutron crossover can also be used to test for "GAS"
flag.
Where:
Hnet = sum of layer thicknesses which passed all cutoffs (ft or
m)
Perm = permeability (md)
PERMmin = permeability cutoff (md)
PHImin = porosity cutoff (fractional)
PHIe = effective porosity (fractional)
PHIdc = shale corrected density log porosity (fractional)
PHInc = shale corrected neutron log porosity (fractional)
PHIxSWmax = porosity saturation product cutoff (fractional)
Sw = water saturation (fractional)
SWmax = saturation cutoff (fractional)
TOLER = crossover tolerance for "GAS" flag (fractional)
Vsh = volume of shale (fractional)
VSHmax = shale volume cutoff (fractional)
RECOMMENDED
PARAMETERS:
1. High porosity set:
PHImax SWmax PERMmin VSHmin PHIxSW
0.00 1.0 0.0
0.0 1.00
0.15 0.5 5.0 0.3 0.07
0.20 0.4 10.0 0.3 0.07
0.25 0.3 15.0 0.3 0.07
2.
Low porosity set:
PHImax SWmax PERMmin VSHmin PHIxSW
0.00 1.0 0.0
0.0 1.00
0.01 0.90 0.005 0.7 0.10
0.03 0.85
0.01
0.6 0.09
0.05 0.80 0.05 0.5 0.08
0.07 0.70 0.10 0.4 0.07
0.09 0.50 0.50 0.4 0.06
0.12 0.40 1.00 0.4 0.05
Selecting Cutoffs
The
only real way to determine cutoffs is to run a flowmeter in the
well over the reservoir. If an interval flows oil or gas, it is
above cutoffs - if it doesn't flow oil or gas, it's below cutoffs.
If it flows water with oil or gas, it has failed the water saturation
cutoff. This procedure requires that you perforate poor quality
rock to see if it will flow. Some managers will resist this added
expense as they "know" what produces and what doesn't.
Close
spaced DST's can also be used in open or cased hole to simulate
a flowmeter profile.
You
can mimic this in the lab with flow tests in core plugs using
reservoir fluids under simulated formation pressure and temperature.
However, hardly anyone actually does either flowmeter or core
flow analysis because it is expensive and often means completing
or coring poor quality rock to find out how low the cutoffs can
be set.
The
pragmatic approach is much more widely used.
1.
Plot core porosity vs logarithm of core permeability. Fit a semi-log
line through the data points (exclude fractured plugs). For gas
use a perm cutoff of 0.1 to 1.0 md, for oil use 1.0 to 5.0 md.
Find the equivalent porosity on this graph corresponding to the
selected perm cutoff. This is your porosity cutoff.
2.
Plot porosity vs water saturation in the oil or gas leg above
the transition zone. This can be log analysis data or values from
capillary pressure curves. Fit a hyperbolic line through the data.
Enter with porosity cutoff and find corresponding SW. This is
the SW cutoff.
3.
In shaly sands, plot porosity vs shale volume. Enter graph with
porosity cutoff and pick corresponding shale volume. This is Vsh
cutoff.
This
is called a coordinated cutoff set.
Reservoir
engineers sometimes plot cumulative porosity or permeability or
both (sort data into ascending order first). They then place the
cutoff at the 5 or 10% accumulation. This is exceedingly arbitrary
but was a widespread method. It was only vaguely useful if the
core contained no poor quality rock or if there was no spread
in the rock properties.
Net Pay Continuity Calculation
In
some situations, the continuity of the pay zone is important to
exonomic decisions. Tar sand mining, steam assisted gravity
drainage, fire floods, and some water flood scenarios need
continuous reservoir quality rock to be effective. Thin non-pay
intervals are OK, but thick ones are not.
Net Pay Continuity Calculation
The
levels that pass these four tests can be checked for continuity
against two thickness criteria. One is the minimum zone thickness
needed to be considered as a pay zone. The second is a maximum
non-pay interval allowed in the overall pay zone before the zone
is broken into more than one pay zone. These two criteria are
called the acceptance thickness and rejection thickness respectively.
To
find the beginning of a possible pay zone, search from the top
of the computed interval for the first data set with a "pass"
in its cutoff field.
Then
find the first deeper level with a "fail" in its cutoff
field. The depths of these two points define the top (ZONETOP)
and bottom (ZONEBOTTOM) of a zone. This interval thickness is
tested against the acceptance criteria.
The
depth of the next pay zone top is then found and the interval
between pay zones tested against the rejection criteria.
1:
IF PAYFLAG$ ="OIL"
2: OR IF PAYFLAG$ ="GAS"
3: OR IF PAYFLAG$ ="H2O"
4: THEN CUTOFF$ = "PASS"
5: OTHERWISE CUTOFF$ = "FAIL"
6: IF CUTOFF$ = "PASS"
7: AND TOPFLAG$ = "START"
8: THEN ZONETOP = Depth
9: AND TOPFLAG$ = "TOPFOUND"
10: AND BOTTOMFLAG$ = "START"
11: IF CUTOFF$ = "FAIL"
12: AND BOTTOMFLAG$ = "START"
13: THEN ZONEBOTTOM = Depth
14: AND BOTTOMFLAG$ = "BOTTOMFOUND"
15: AND TOPFLAG$ = "START"
16: AND NEXTTOPFLAG$ = "START"
17: IF CUTOFF$ = "PASS"
18: AND NEXTTOPFLAG$ = "START"
19: THEN NEXTTOP = Depth
20: AND NEXTTOPFLAG$ = "TOPFOUND"
21: IF ZONEBOTTOM - ZONETOP > HACCEPT
22: THEN FOR Depth = ZONETOP
23: TO Depth = ZONEBOTTOM
24: PAYFLAG$ = "PAY"
25: OTHERWISE PAYFLAG$ = "BARREN"
26: END LOOP 2
27: IF NEXTTOP - ZONEBOTTOM < HREJECT
28: THEN FOR Depth = ZONEBOTTOM
29: TO Depth = NEXTTOP
30: PAYFLAG$ = "PAY"
31: OTHERWISE PAYFLAG$ = "BARREN"
32: END LOOP 3
33; END LOOP 1
Repeat
these steps until the bottom of the computation interval is reached.
At
this time each level computed will have two flags set - one to
indicate whether it passed cutoffs (CUTOFF$) and whether the layer
is considered part of a pay zone (PAYFLAG$), even if it failed
its cutoffs. To find net pay thickness, count the number of levels
with the pay flag equal to "pay" and multiply by the
depth increment between the data points.
32:
Hnet = Sum ((IF PAYFLAG$ = "PAY") * THICKi)
33: Hgross = ZONETOP - ZONEBOTTOM
34: NETratio = Hnet / Hgross
Where:
Depth = current depth (ft or m)
HACCEPT = minimum pay zone thickness cutoff (ft or m)
Hgross = gross interval (ft or m)
Hnet = sum of layer thicknesses which passed all cutoffs (ft or
m)
HREJECT = maximum reject zone thickness cutoff (ft or m)
NETratio = ratio of net to gross pay (fractional)
NEXTTOP = top depth of next pay zone (ft or m)
THICKi = individual layer thickness (ft or m)
ZONEBOT = bottom of computation interval (ft or m)
ZONETOP = top of computation interval (ft or m)
COMMENTS:
Some analysts prefer not to count layers which failed cutoffs
but are included in net interval because they are too thin to
be rejected. To accomplish this, change Step 39 to read:
39:
Hnet = Sum ((IF PAYFLAG$ = "PAY" AND IF CUTOFF$ = "PASS")
* THICKi)
NUMERICAL
EXAMPLE
Assume data as shown
below. Note that data listing is
in percent, not fractional, units.
Data for net pay example
1.
If cutoffs are:
PHIcut = 3.0 (%)
VSHcut = 40.0 (%)
PERMcut = 0.0 (md)
SWcut = 90.0 (%)
PHIxSWcut = 1.0
HACCEPT = 1.0 (m)
HREJECT = 0.0 (m)
Then
net pay extends from 2054.1 to include 2063.1.
2.
If SWcut is lowered to 50.0, then net pay covers 2054.1 to 2059.5
and 2061.9 to 2062.2 in two zones.
3.
If HREJECT = 3 m, then these two pay zones combine to form one
zone because the rejected interval is less than 3.0 m.
4.
If HACCEPT = 3.0 m, then the second zone is not pay because it
is not thick enough.
Rejected
intervals are included in the zone for Case 3 and contribute to
net pay thickness.
|