|
 INFRA-RED QUANTITATIVE
SAMPLE DESCRIPTIONS INFRA-RED QUANTITATIVE
SAMPLE DESCRIPTIONS
The typical sample description log is a qualitative description of the rock
samples recovered from the mud system during the drilling operations
at a well site or from conventional or sidewall cores taken over
specific intervals in the well. Semi-quantitative analysis can be done using a
microscope and eyeball estimates of the quantities of each mineral
present. This is a little imprecise but may resolve some issues.
X-Ray diffraction spectroscopy (XRD) is another quantitative method
for description of the mineralogy of cuttings or core samples.
Infra-red spectroscopy is a somewhat newer technology. Infra-red
analysis of washed samples can resolve most minerals, including
clays and organics, into a quantitative breakdown. It can be
performed at the well site, as part of the other sample description
and gas logging process (measurements while drilling) or in a
laboratory after drilling the well.
There are two types of infra-red spectroscopy. The
most common is transmission, or absorption, infra-red spectroscopy,
in which the spectra are inverted to a mineral assemblage by a
Fourier Transform algorithm, commonly abbreviated as FTIR. Another
independent method is diffuse reflection infra-red Fourier Transform
spectroscopy, better known as DRIFTS. DRIFTS is newer, faster, and
cheaper than conventional FTIR. Although the transmission and
reflection spectra are quite different in appearance, both
techniques give very similar results.
Samples from cores can also be used. Small samples
(0.5 to 1.0 grams) are crushed and placed in the FTIR apparatus,
where IR absorption spectrum is scanned with a broad range of
infra-red frequencies. Each mineral, liquid, and gas has a unique
spectrum, allowing the software to identify
each mineral by comparing to pure mineral spectra.
Multiple scans of the same sample are used to increase signal to
noise ratio.
With the most recent development of wellsite instruments, a typical measurement
takes two to three minutes. Results in weight percent or mass
fraction are
stored on disc and displayed on request. Sample preparation can
take a few minutes as well.
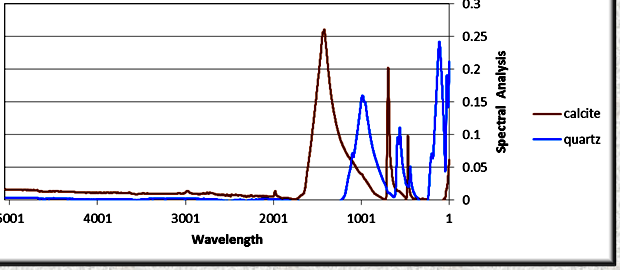
FTIR absorption spectra for calcite and quartz after being
processed by the Fourier transform software. The peaks are due to
covalent bonds in the molecules and give a unique pattern for each
mineral. The relative amplitudes of peaks compared to pure mineral
standards are used to estimate the quantity of each mineral present
in a mixture. (image: Ana-Min)
FTIR
LOG EXAMPLES
A log of results versus
depth is constructed by the FTIR software package and can augment
the conventional sample log or stand alone for comparison to
wireline or computed log analysis results.
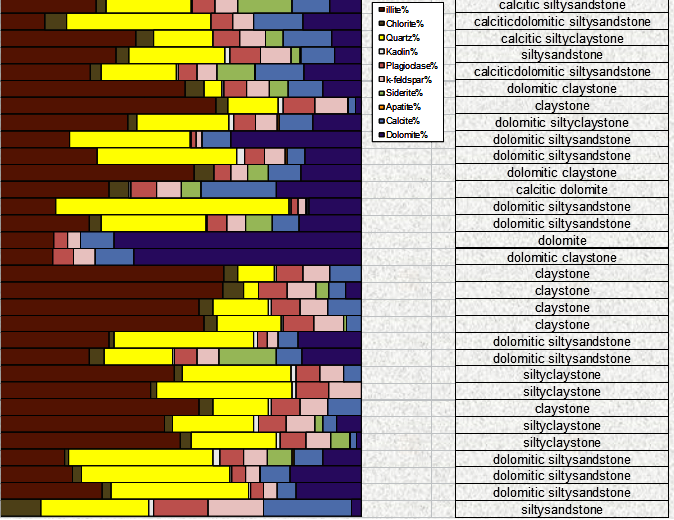
An FTIR quantitative sample log, measured in
weight percent, with interpreted
lithology description (images courtesy of Ana-Min)
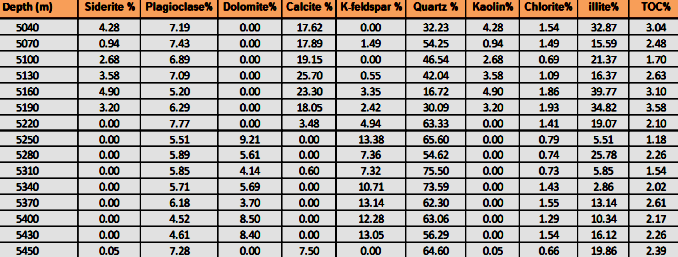
Tabular listing of FTIR quantitative mineralogy, measured in weight
percent, can be loaded into
petrophysical analysis software in a manner similar to core analysis
or XRD data, to assist in calibrating analysis results. Note the
availability of TOC data in this example.
The technique is quite new and not yet widely
used at the wellsite. It has applications in conventional and
unconventional reservoirs, including shale gas, tight oil, and coal
bed methane. It can provide a quantitative estimate of total organic carbon (TOC)
and quantitative mineralogy and clay volume without waiting to
transport and analyze samples in the laboratory. Since it is a
near-real time measurement, it can assist in geo-steering of
horizontal or deviated wells.
DRIFTS
LOG EXAMPLES
The example below is from "Kerogen
Content and Maturity, Mineralogy, and Clay Typing from DRIFTS
Analysis of Cuttings or Cores", M.Heron et al, Petrophysics, Oct
2014.
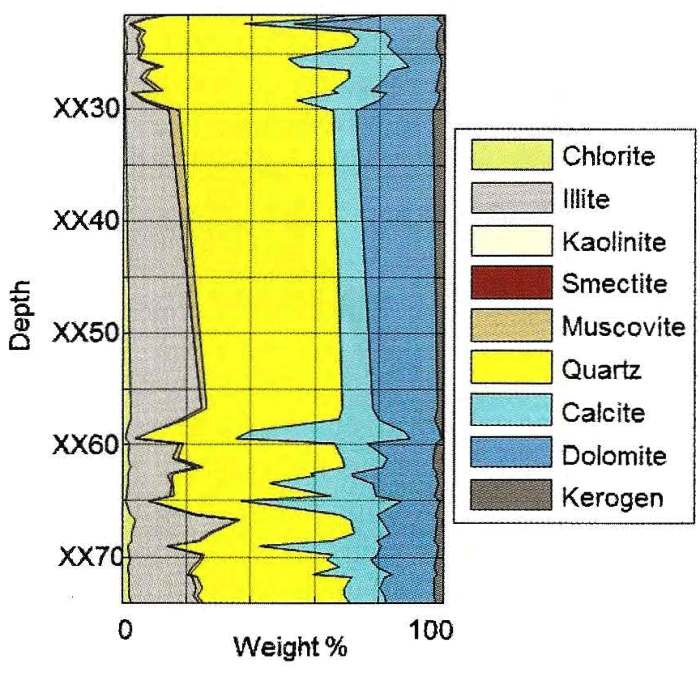
DRIFTS analysis of core samples from the Montney formation in
Alberta. Note that clay content averages about 30% by weight,
quartz-carbonate ratio is about 50:50, and carbonate is mostly
dolomite (with minor calcite-rich layers). Kerogen is about 3%.
Although pyrite weight fraction usually is in the 3 to 8% range in
this interval, none is shown in this example.
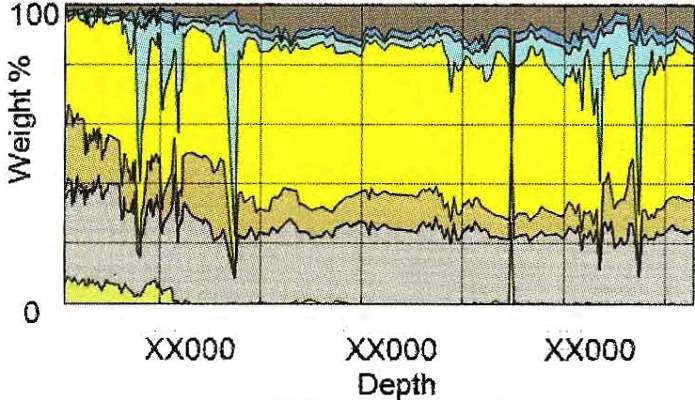
DRIFTS example from cuttings in Marcellus Shale. Clay-quartz ratio
is near 50:50 with little carbonate. Kerogen runs 4 to 12% by
weight. Colour codes same as previous example.
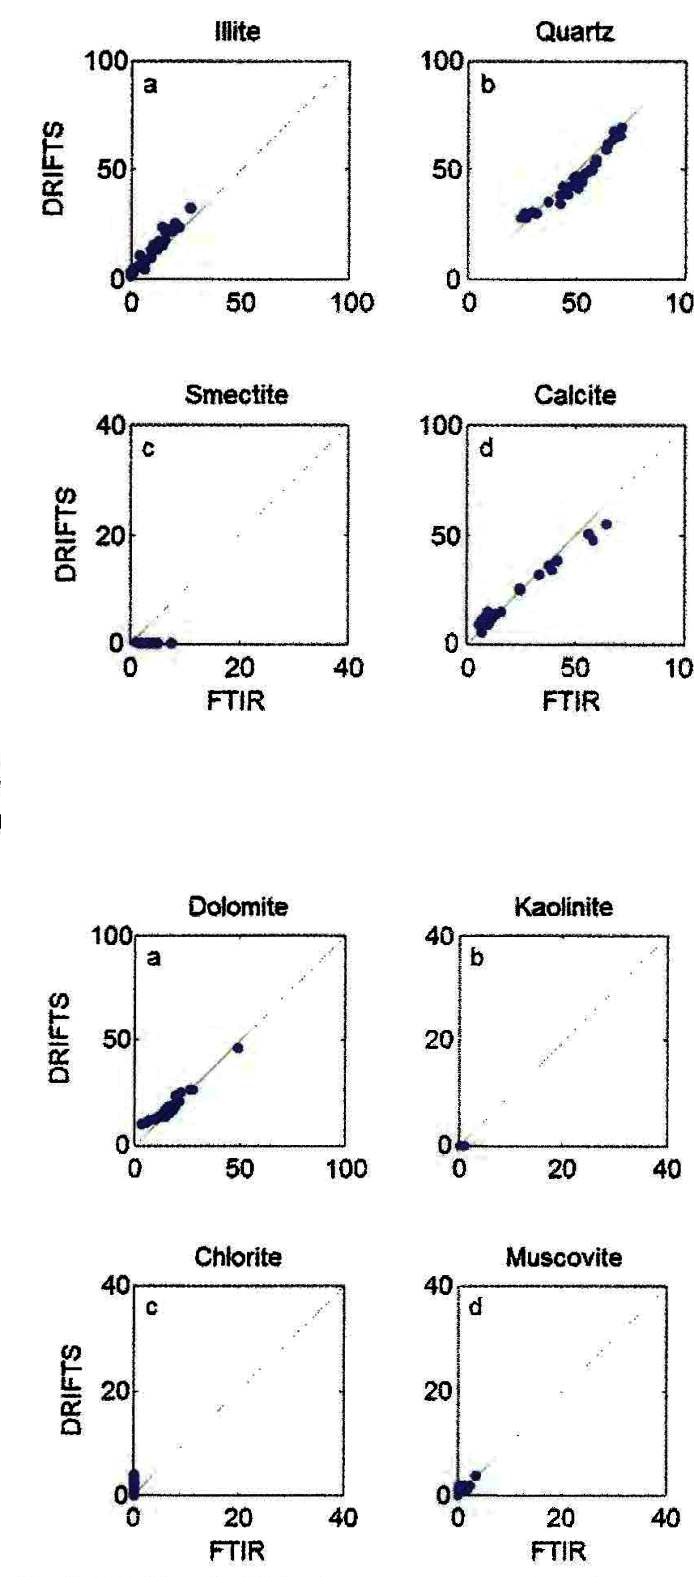
Comparison of DRIFTS and FTIR methods on the same core samples from
the Montney example shown earlier.
THE
INFRA-RED SPECTRUM
Infra-red radiation Is a form of electromagnetic
radiation with frequencies between those visible to humans and those
familiar as radio waves. Ultra-violet, X-rays, and gamma rays are at
higher frequencies.
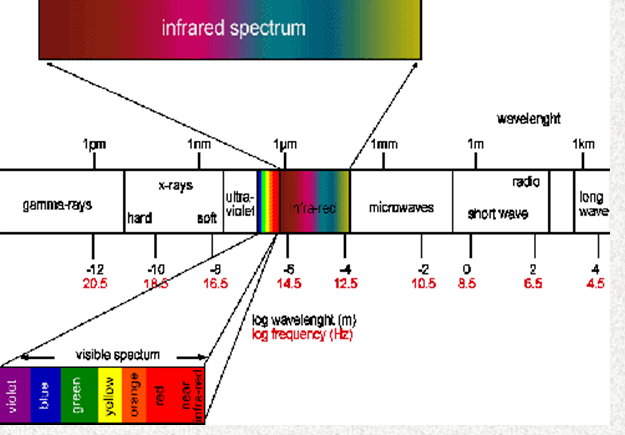
The radiation spectrum shows the infra-red to the lower frequency
side of the visible light region. Ultra-violet, X-ray, and gamma
rays are on the high frequency side of the visible spectrum.
Some definitions are in order:
1: Wavelength = 10^4 / Wave Number
(microns)
2: Wave Number = 10^4 / Frequency ((reciprocal
centimeters - cm^-1)
3: Wavelength = 2.9979 * 10^4 / Frequency
(meters)
In frequency terms, 1 cm^-1 = 2.9979 * 10^9 = 30 Ghz.
Infra-red energy obeys the same laws of transmission, reflection,
and absorption as does visible light. The frequencies absorbed and
reflected by each substance have a unique frequency spectrum or
signature, which depends on the molecular structure of the
substance.
FTIR spectroscopy relies on detection of covalent bonds or molecular
group vibrations. Mineral identification is possible because
minerals have characteristic absorption bands in the mid-range of
the infrared (4000 to 400 cm-1). The concentration of a mineral in a
sample can be extracted from the FTIR spectrum because the
absorbance of the mixture is proportional to the concentration of
each mineral. This is given by Beers Law:
4: A = SUM (Cj * Ej * L)
Where:
A = absorbance of a mineral mixture at a given wavenumber
Ej = absorbtivity of component j
L = the absorption path length (pellet thickness)
Cj is the concentration of component j.
All multi-component analyses are based on Beer’s law, and the
absorbance at a specific wavenumber is the sum of the absorbance of
all sample components that absorb at that wavenumber. Since the
spectrum covers a wide range of wavenumbers, a non-negative least
squares solution to the Cj concentration values is possible.
HOW
FTIR REALLY WORKS
Source:
Wikipedia
The goal of any absorption
spectroscopy is to measure how well a sample absorbs light at each
wavelength. The most straightforward way to do this, the "dispersive
spectroscopy" technique, is to shine a monochromatic light beam at a
sample, measure how much of the light is absorbed, and repeat for
each different wavelength.
Fourier transform spectroscopy is
a less intuitive way to obtain the same information. Rather than
shining a monochromatic beam of light at the sample, this technique
shines a beam containing many frequencies of light at once, and
measures how much of that beam is absorbed by the sample. Next, the
beam is modified to contain a different combination of frequencies,
giving a second data point. This process is repeated many times.
Afterwards, a computer takes all these data and works backwards to
infer what the absorption is at each wavelength.
The beam described above is
generated by starting with a broadband light source, one containing
the full spectrum of wavelengths to be measured. The light shines
into a Michelson interferometer, a certain configuration of mirrors,
one of which is moved by a motor. As this mirror moves, each
wavelength of light in the beam is periodically blocked,
transmitted, blocked, transmitted, by the interferometer, due to
wave interference. Different wavelengths are modulated at different
rates, so that at each moment, the beam coming out of the
interferometer has a different spectrum. The raw data is sometimes
called an "interferogram".
As mentioned, computer processing
is required to turn the raw data (light absorption for each mirror
position) into the desired result (light absorption for each
wavelength). The processing required turns out to be a common
algorithm called the Fourier transform. The interferogram belongs in
the length domain. Fourier transform inverts the dimension, so the
transform of the interferogram belongs in the reciprocal length
domain, that is the wavenumber domain. (end of Wiki extract)
Once the FTIR spectrum has been obtained, the peaks and valleys on
the wave number graph can be compared to standard graphs for pure
minerals recorded in a catalog. By identifying particular peaks, the
minerals present can be identified. The amplitudes of the peaks are
used to estimate the quantity of each mineral. Hardware suppliers
have created proprietary software that can quickly compare thousands
of possible combinations to find a match to the measured spectrum.
The task is simplified by choosing an appropriate mineral "package"
that best represents the rock sequence, thus reducing the number of
comparisons required. That mineral package contains the spectra for a
few to a few dozen pure minerals.
|