Petrophysical Training
Licenses
|
 SAMPLE DESCRIPTION BASICS SAMPLE DESCRIPTION BASICS
The wellsite geologist is responsible for inspection of rock samples
as they are gathered and preparation of the sample log. He may
delegate this to the mud loggers if they are on site. The wellsite
geologist also is responsible for a myriad of other tasks, including
ordering geological supplies, picking the location of cores and
tests, packing and shipping recovered cores and fluid samples,
calling for and supervising wireline logging operations, velocity
surveys, mud logging crews, and other survey personnel, liaison with
drilling crews and home office, and above all, must be a good
cribbage or gin rummy player.
The sample log, often called the stratigraphic log, strat log, or
geology log, is a record of the rock samples retrieved from the
drilling mud, and is one of the primary sources of rock and fluid
descriptions for the well. It consists of a verbal description of
the rock type as well as qualitative or interpretive data concerning
evidence of the fluid content of the rock. Sample description is
sometimes called formation evaluation, but this term usually covers
a broader scope, including drill stem test a and log analysis.
Cuttings are collected, washed, and described at 5 to 20 foot (2 to
5 meter) intervals unless extremely rapid penetration rate makes
this impractical. In such cases, they would then be collected as
often as possible, but no less than once for each time drilling is
resumed after a pipe connection. A constant sampling rate is chosen,
depending on the lithology expected.
Sample chips are quite small, so large scale features such as
fractures, bedding planes, and fossils often cannot be seen. Samples
can be contaminated by rock sloughing from above, or may be lost due
to lost circulation, pulverization, or careless well site
procedures.
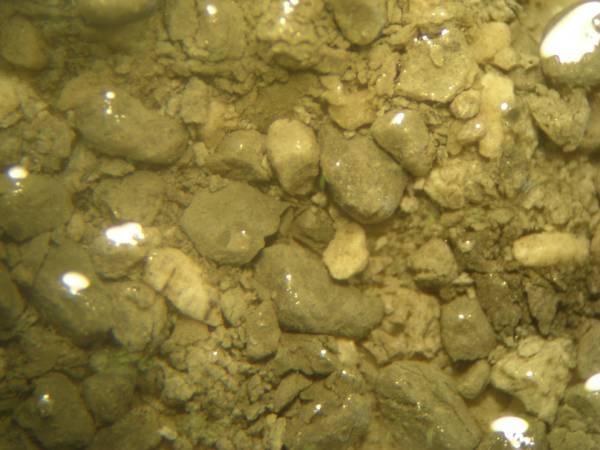
Washed sample of a siltstone magnified 20 times
Washed rock chips are observed under a microscope (10 to 20 power)
and described as to mineralogy, colour, texture, rounding, sorting,
grain size, cementing minerals, porosity, porosity type,
permeability, macro fossils, and fractures. These are qualitative
descriptions. Quantitative values usually come from core
analysis and log data, but semi-quantitative lithology analysis is
possible under the microscope. Obvious formation tops, marker beds, and
lithology changes are listed. Drill stem test recoveries, coring
intervals and coring times, logs run, bit changes, and other
logistical data which might
influence the understanding of the sample log are given.
Obvious formation tops, marker beds, and lithology changes
are listed. Drill stem test recoveries, coring intervals and coring
times, logs run, bit changes, and other logistical data which might
influence the understanding of the sample log are given.
 Sample descriptions will include an estimate of visual
porosity, porosity type, grain size, sorting, roundness, and colour,
as well as shale distribution, brittleness, laminations, and colour. Sample descriptions will include an estimate of visual
porosity, porosity type, grain size, sorting, roundness, and colour,
as well as shale distribution, brittleness, laminations, and colour.
Primary
porosity is the porosity developed by the original sedimentation
process by which the rock was created. In reports, it is often
referred to in terms of percentages, while in calculations it is
always a decimal fraction.
Secondary porosity is
created by processes other than primary cementation and compaction
of the sediments. An example of secondary porosity can be found in
the solution of limestone or dolomite by ground waters, a process
which creates vugs or caverns. Fracturing also creates secondary
porosity. Dolomitization results in the shrinking of solid rock
volume as the material transforms from calcite to dolomite, giving a
corresponding increase in porosity.
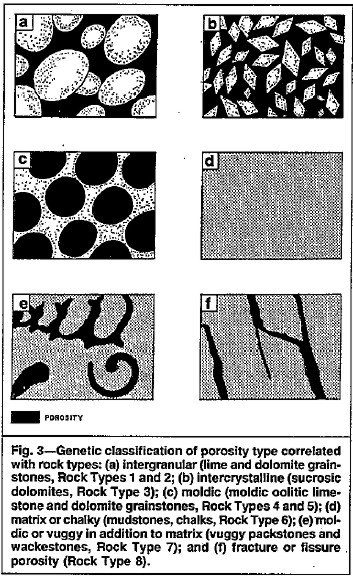
Porosity Types: a. intergranulas, b. Sucrosic,
c. Moldic or Oolitic, d.
Matrix or Chalky,
e. Moldic or Vuggy, e.
Fracture porosity.
Intergranular porosity is
primary, the
balance are secondary.

For details,See
Also:
Shale Basics
Porosity Basics
Oil show indicators are found by examination of the rock samples for
oil stain, bleeding, fluorescence, or cut. Stain is the trace of asphaltic material left behind on drill cuttings after the oil has
been washed off during drilling. Stain left by high quality oil has
a typical iridescent sheen, visible in normal light. Bleeding is the
exudation of oil from the pores due to pressure release as the
sample is brought to the surface.
Fluorescence represents oil's distinctive ability of emitting light
in the visible range when exposed to ultraviolet light.
Unfortunately, quite a number of minerals and many refined products
are fluorescent, so there is a certain amount of technique involved
in distinguishing between primary hydrocarbons and refined products
or fluorescent minerals.
A simple chemical test may be carried out to determine whether
fluorescence in drill cuttings is a result of oil or some
fluorescing mineral. This is easily and quickly established by
immersing some of the drill cuttings in a petroleum solvent (chlorothene,
trichlorothene, ether, or acetone). If the fluorescence is derived
from mineral sources, the minerals will not dissolve in the solvent
and the solvent will remain colorless under ultraviolet light.
However, if hydrocarbons are present in the rock, they will
disseminate into the solvent, giving the entire solvent a
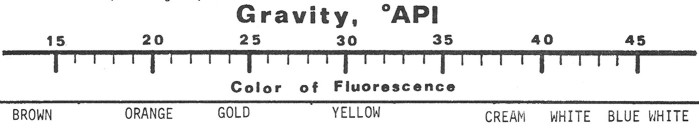
distinctive color under ultraviolet light. This sheen under UV light
is called cut and the colour of the cut indicates the quality of the
oil. Pale blue-white is high gravity (light) oil, yellow is medium
gravity, and orange-brown for low gravity (heavy) oil.
Lightly washed wet samples should also be examined, and not dried,
because light oils and condensates may evaporate. Under UV light, a
differentiation should be made between mineral fluorescence, natural
hydrocarbon fluorescence, and fluorescence from introduced oils and
grease. Natural hydrocarbon fluorescence will usually be lithology
specific, while introduced hydrocarbon fluorescence will be
associated with all lithologies. A note of percentage of cuttings
exhibiting natural hydrocarbon fluorescence and the color and
intensity should be made. Mineral fluorescence is determined by the
test for cut.
Under ordinary light, the oil stain or oil bleeding from the sample
may be visible. It should be noted for its volume and its intensity,
and efforts made to distinguish introduced oil. Bleeding often
indicates low permeability. Light oils are more prone to exhibit
irridescence, while dark stains tend to indicate heavier crudes.
To test for hydrocarbon cut, a small sample is placed in a spot
plate, the solvent is introduced, and the color, intensity, and rate
of cut are observed in ordinary and ultraviolet light. The sample is
crushed and the test is repeated. If there is no cut at this stage,
any fluorescence is probably mineral derived. Generally, the heavier
the oil, the greater the cut; however, asphaltic oils show a greater
cut than paraffinic oils of the same gravity.
The chromatography of the oil should be noted. A drop sample of
hydrocarbon contaminated solvent should be placed on filter paper
and observed under ordinary and ultraviolet light. The
characteristics of any separation should be noted, including the
number of rings formed.
Larger samples, or a number of smaller samples, may be placed in a
test tube and examined in a similar manner as in a spot plate; the
sample should be crushed and the solvent introduced. A standard
method should be employed so comparisons can be made with nearby
wells, ie., 1 cc of crushed cuttings in 2 cc of solvent in a
standard 10 cc test tube.
A control test tube of 3 cc solvent should also be set up, and a
comparison against white paper is then observed. Again, a drop of
hydrocarbon contaminated solvent should be tested for chromatography
as before.
To test for gas in the cuttings, place an unwashed sample in a
blender or food processor, add water, and analyze the resulting gas. This is done by running a sample of the headspace gas into the gas chromatograph
operated by the mud logging crew.
Sample containing carbonates, either as a main constituent or as a
cement, can be tested further for oil by adding a small amount of
hydrochloric acid. Hydrocarbons present in a sample, either natural
or introduced, will cause carbon dioxide bubbles, released by the
action of hydrochloric acid on carbonates, to enlarge by forming an
oil film around the bubbles. Thus, the reaction is more prone to
frothing. This test is very sensitive, but it does not differentiate
between natural and introduced hydrocarbons.
The sample log can take many forms: a written narrative, a graph
versus depth with a schematic drawing (along with abbreviated verbal
descriptions), or a mud log, which describes the rock samples, as
well as fluids, recovered in the mud. Drilling data such as
penetration rate may also be included.
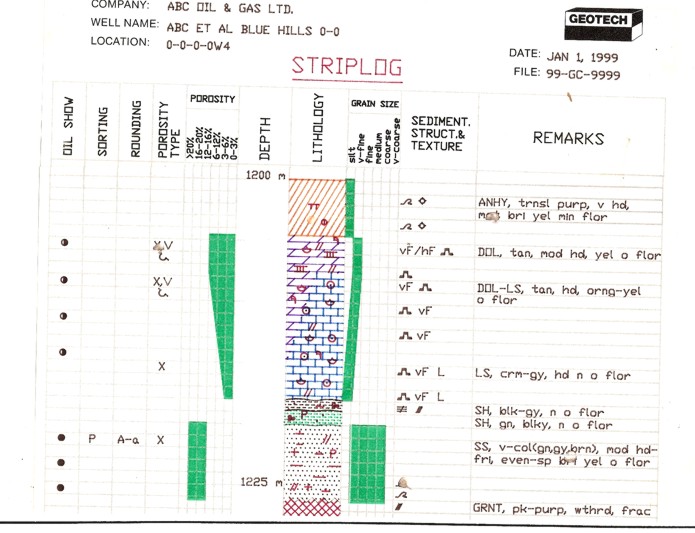
Example of a sample description log
Below is a a sample of the colours and symbols in use for lithology
descriptions on modern sample description logs. For a complete list of
abbreviations and symbols used in geological sample descriptions,
see This List.
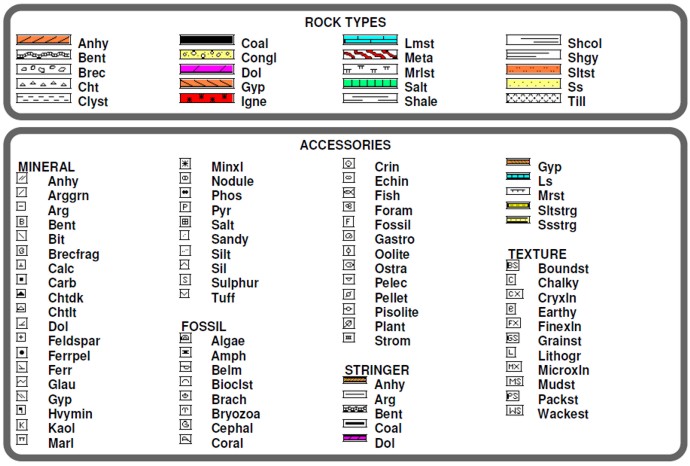
Colour codes and symbols used to plot lithology and accessory
features on a sample description log
All sample log results are reported daily by telephone, FAX, or
email and recorded on a standard report form for distribution within
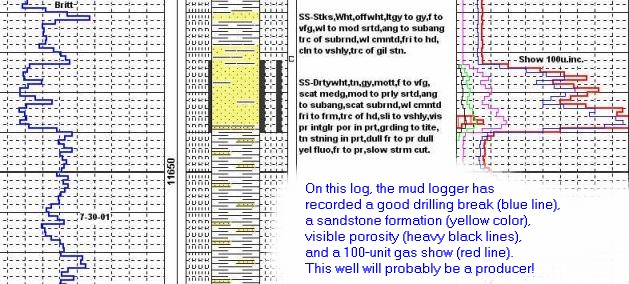
the oil company. Hydrocarbon shows are especially desirable; a show
is defined as any indication of hydrocarbons, ie., stain,
fluorescence, or cut, or any increase in drilling mud gas of
reasonable percentage above background.
LAG
TIME
Depth information is obtained from the driller's log, which records
depth versus the time of day. However, these depths cannot be used
directly. We wish the mud log data to be presented at the depth of
the drill bit, but the mud log measurements are made at the surface.
The time it takes for the mud to move from the bit to the surface
must be accounted for in positioning samples and gas kick data on
the log. This time is called the lag time and depends on the
velocity of the mud in the annulus between the drill pipe and the
rock. This in turn depends on the mud pump speed and displacement,
which are usually constant
for reasonable periods of time.
The lag time can
vary from a few minutes in an air drilled hole, to hours in a deep
mud filled hole. If lag time is much shorter than expected or
multiple lags are found, it usually means a leak in the drill pipe
which must be repaired immediately. The most reliable method of
establishing the lag time is to use a tracing material such as oats,
corn, paint, or calcium carbide. Carbide will produce a bubble of
acetylene gas. Typically, a sample of tracing material is introduced
into the drill pipe during a connection and circulated down through
the bit jets and back up the annulus. The use of calcium carbide as
a lag tracer has a secondary benefit. It permits verification that
the entire gas detection system is functioning. Since it is
necessary for the gas detector to extract, pump to the logging unit,
and sense the acetylene gas, it verifies the integrity of the entire
system.
This is only part of the story, as the time it takes the tracer to
go down the inside of the drill pipe must first be calculated from
the pump displacement, pump speed, pipe diameter, and pipe length.
The calculated downward time is deducted from the total measured
time to find the lag time.
SAMPLE DESCRIPTION LOG EXAMPLES
Below are examples of sample
description logs from various eras.
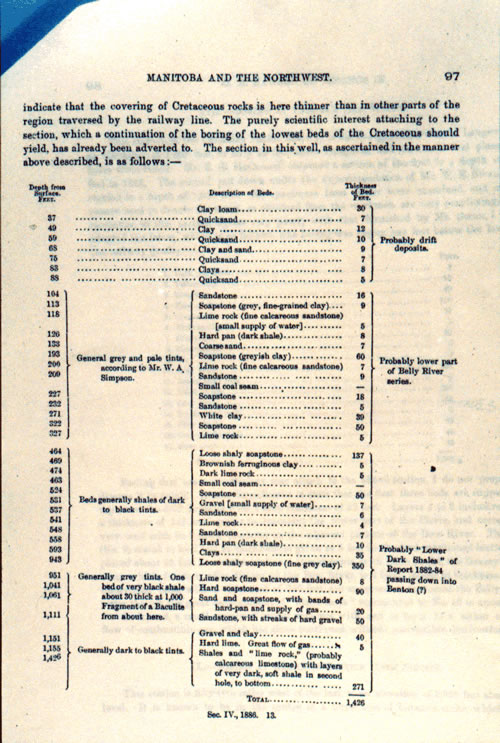
One of the first well logs in Western Canada
from Proceedings and Transactions of the Royal
Society of Canada
for the Year 1886 Volume IV.
Glenbow Archives
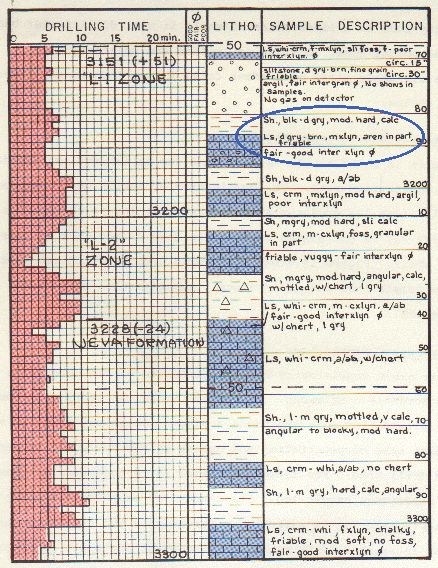
A hand drawn sample log typical of the 1940 to 1970 era.
A computer drawn sample log of the 1980's. Hand drafted logs could
be drawn as neatly as this using lettering guides.
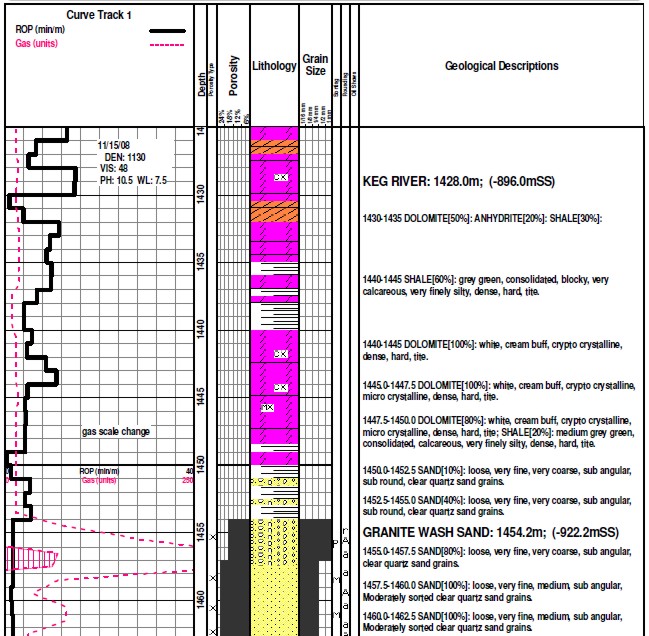
Modern sample log using colour and computer graphics symbols.
|
|