|
 MUD LOGGING BASICS
Mud logging, also known as
hydrocarbon well logging or gas logging, entails gathering qualitative and
semi-quantitative data from hydrocarbon gas detectors that record
the level of natural gas brought up in the mud. Chromatographs are
used to determine the chemical makeup of the gas.
Other properties such as drilling rate, mud weight, flowline temperature,
oil indicators, pump pressure, pump rate, lithology (rock type) of
the drilled cuttings, and other data are recorded. Sampling the drilled cuttings,
usually under the direction of the wellsite geologist,
must be performed at predetermined intervals.
The main purpose is to identify all
hydrocarbon indications from the rock samples and from the oil and
gas entrained in the drilling mud. Gas detected in the mud can be
interpreted to be:
1. liberated gas
2. recycled gas
3. produced gas
4. contamination gas
5. trip gas
Only liberated gas indicates a possible prospect; the others merely
confuse the analyst. This data, combined with the gas composition
determined from a chromatograph, assists in the location of oil and
gas zones as they are penetrated. The breakup of the gas shows into
these categories reduces the chance of misinterpretation of a gas
kick on the mud log.
Another important use of these logs
is well safety, since overpressured zones, lost circulation, and
gas kicks will be recognized quickly and remedial action taken.
Total gas in the mud is measured in
units of parts per million, but does not represent the actual
quantity of oil or gas in the reservoir. Total gas is separated in a
chromatograph. The most common gas component is methane (C1). Heavier
hydrocarbons, such as C2 (ethane), C3 (propane), and C4 (butane)
may indicate an oil or a "wet" gas zone. Heavier molecules, up to C7
may be recorded. An example of a sample description log
with the gas mud log is shown below.
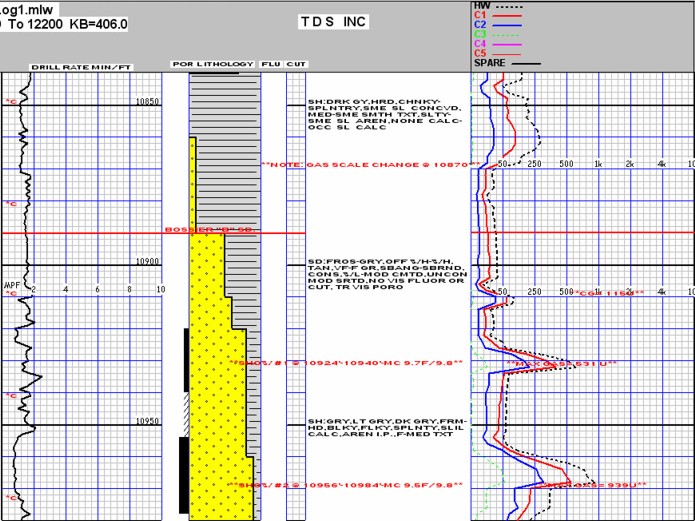
Modern mud log with drilling mechanics, sample descriptions, and mud
gas readings, showing two
potential gas zones.
Gas in the mud
system may indicate the penetration of either an oil or a gas
reservoir. The first objective is to detect the presence of the gas
with some form of total gas detector. The second step is to break
down the gas into its components with a gas chromatograph to see if
the gas comes from an oil or gas show.
For many years the simple hotwire, or as it is properly called,
catalytic combustion detector, has been the cornerstone of all gas
detection service. This device was the first mechanical replacement
for canaries in mines and is characterized by its simplicity and
reliability.
Several other detecting devices have been utilized from time to time
including the mass spectrometer, infrared analyzers, thermal
conductivity, and gas chromatographs. Regardless of which gas detecting instrument is used,
they are all limited by the amount of gas in the mud that can be
extracted and fed into the instrument.
If gas is seen on the log in quantities larger than the average
background, the question arises, "Is this a significant increase and
does it indicate a gas or oil zone?" Similarly, "How much
fluorescence in the cuttings indicates an oil zone?" The simple and
quick answer to both of these questions is, "We don't know, yet!"
 Generally
speaking, extremely dry gas should give mostly C1 and not much C2, C3, or C4.
If ratios are presented on the log, each of C1/C2, C2/C3, C1/C4, and
C1/C5 will be greater than 50. Wetter gas will have ratios between
20 and 50. Oil zones will have ratios between 2 and 20. Local
knowledge should be used to refine these cutoffs. Generally
speaking, extremely dry gas should give mostly C1 and not much C2, C3, or C4.
If ratios are presented on the log, each of C1/C2, C2/C3, C1/C4, and
C1/C5 will be greater than 50. Wetter gas will have ratios between
20 and 50. Oil zones will have ratios between 2 and 20. Local
knowledge should be used to refine these cutoffs.
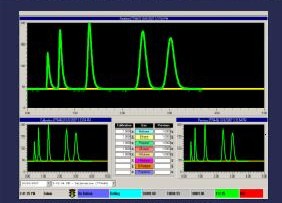
Spectroscope waveforms on computerized gas
mud logging unit (Illustration courtesy
of
Petro Log
International, Inc.

Usually,
there is enough empirical control from offset well histories to make a positive interpretation,
but there are so many variables involved that
this is not always possible immediately. After drilling is completed, the mud
log, sample log, open hole logs, and drill stem tests are used to
come to a final analysis.
These results are used on the next hole in
the same area as guides to more immediate interpretation on that
well. To achieve the best possible interpretation, it is vital to
integrate all of these tools at the very earliest point in the
evaluation process. Integration of all the petrophysical data is the
key to success.
To be useful, any log must be calibrated. Mud logs are no exception,
and most modern mud logs have been calibrated to a local or API
standard. However, many older
logs in the well file have not. This makes it even more difficult to
determine what the gas kicks mean.
LAG TIME
Depth information is obtained from the driller's log, which records
depth versus the time of day. However, these depths cannot be used
directly. We wish the mud log data to be presented at the depth of
the drill bit, but the mud log measurements are made at the surface.
The time it takes for the mud to move from the bit to the surface
must be accounted for in positioning samples and gas kick data on
the log. This time is called the lag time and depends on the
velocity of the mud in the annulus between the drill pipe and the
rock. This in turn depends on the mud pump speed and displacement,
which are usually constant
for reasonable periods of time.
The lag time can
vary from a few minutes in an air drilled hole, to hours in a deep
mud filled hole. If lag time is much shorter than expected or
multiple lags are found, it usually means a leak in the drill pipe
which must be repaired immediately. The most reliable method of
establishing the lag time is to use a tracing material such as oats,
corn, paint, or calcium carbide. Carbide will produce a bubble of
acetylene gas. Typically, a sample of tracing material is introduced
into the drill pipe during a connection and circulated down through
the bit jets and back up the annulus. The use of calcium carbide as
a lag tracer has a secondary benefit. It permits verification that
the entire gas detection system is functioning. Since it is
necessary for the gas detector to extract, pump to the logging unit,
and sense the acetylene gas, it verifies the integrity of the entire
system.
This is only part of the story, as the time it takes the tracer to
go down the inside of the drill pipe must first be calculated from
the pump displacement, pump speed, pipe diameter, and pipe length.
The calculated downward time is deducted from the total measured
time to find the lag time.
GAS
DETECTION METHODS
The total gas detector provides the basic quantitative indication as
to how much gas is being extracted from the drilling mud by the gas
trap. Total gas detection and analysis equipment in use throughout
the world
incorporates one of two standard detectors, the catalytic filament
detector, also called a hotwire detector, and the hydrogen flame ionization
detector.
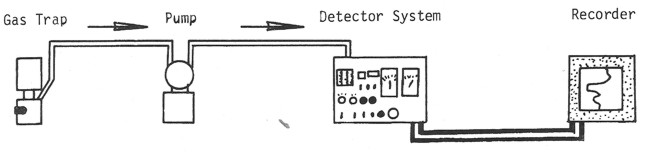
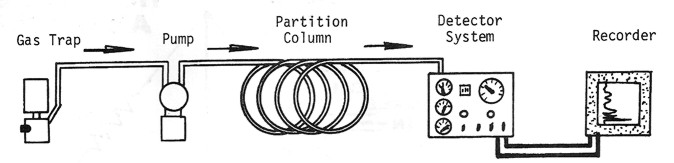
Schematic diagram of a mud gas detection system for total gas.
The hotwire operates on the principle of catalytic combustion of
hydrocarbons in the presence of a heated platinum wire at gas
concentration below the lower explosive limit. The increasing heat
due to combustion causes a corresponding increase in the resistance
of the platinum wire filament. This resistance increase is measured
through the use of a Wheatstone bridge circuit and recorded as
"units of gas".
The common hotwire detector responds to all combustible gases. It is
limited in its range since there must be sufficient oxygen present
in the sample mixture to enable all of the hydrocarbons present to
be catalytically oxidized by the platinum filament.

Schematic diagram of hotwire gas detector
The hydrogen flame ionization detector functions on the
principle of hydrocarbon molecule ionization in the presence of a
very hot hydrogen flame. These ions are subjected to a strong
electrical field resulting in a measurable current flow, which is
then amplified and recorded as "units of gas".
Detailed analysis of the hydrocarbon mixture is usually performed by
a gas chromatograph. The principal difference between a total gas
detector and a gas chromatograph is the partition column, which
breaks the gas stream into its component parts.
Most oilfield gas chromatographs are rapid sampling, batch
processing instruments that provide an accurate proportional
analysis of the paraffin series of hydrocarbons from methane through
pentane.
Occasionally, special features are built into chromatographs to
enable them to identify and measure hydrogen and various air
components. The information produced by the chromatograph is
reported in units or in mole percent of each component of the gas
detected.
Schematic diagram of gas spectrometer, showing retention chamber to
segregate the gases.
Gas chromatograph columns vary in design, but have several
characteristics in common. They start with a long, small diameter,
metal tube which is filled with a particulate material. This filling
material is referred to as the solid phase or support phase. Its
purpose is to provide a large surface area within the column. In
many instances, a liquid phase is laid down over the surface of each
of these grains or particles in order to increase its surface
activity. It is desirable to have highly active surface
characteristics so that there is a strong attraction between the
various gas molecules and the surface of the support material.
The degree of attraction between the active surfaces of the column
and the different gases passing through varies as a result of
different physical and chemical characteristics. By selecting the
proper column, it is possible to separate almost any suite of gases.
Typically, oilfield chromatographs are designed to separate the
paraffin series of hydrocarbons at room temperature, using air as
a carrier.
The carrier gas applies the energy required to
keep the molecules of a gas mixture moving through the column. It
flows at a constant rate. Since each different molecule is
attracted in different degrees to the the surface active material in the
column, they will be propelled at different rates.
The time of transit for a given gas to pass through a particular
column under specified flow conditions is referred to as the
retention time. Retention time is the principle method of
identifying various gases in a mixture. Since each column has
different permeability characteristics, it is necessary that known
gas standards be passed through the column and that their retention
times be established if this analytical method is to be reliable.
The partition column separates a slug of gas into its components by
delaying the passage of the heavier compounds. The amount of each
component must still be detected by devices similar to the total gas
detectors, or other more elaborate devices. Some are as
simple as measuring the gravity of the gas coming out. Other common
types involve measuring combustion ratios, thermal
conductivity, and carbon content.
Since the retention times and response characteristics of each
chromatograph are unique, it is necessary that standard blends of
calibration gases be introduced into the instrument on a regular
basis to establish the instrument's response characteristics.
Once the response graph has been established for a particular
instrument, then raw readings can be easily entered into the graph
and read out in percent. With modern computer controlled equipment,
the conversion factors are applied automatically.
 Operators are often interested in detecting hydrogen sulfide for
personnel safety or to initiate treatment to prevent deterioration
of drilling equipment. Hydrogen sulfide in drilling mud has an
erratic and detrimental effect on the continuous gas detector. H2S
is easy to detect, however, and can be removed from the gas sample to
prevent adverse effects without influencing hydrocarbon detection. A
preset alarm indicator on the continuous H2S detector announces the
presence of potentially dangerous concentrations. A quantitative
determination of H2S in the air from any sample point may also be
made for personnel safety and recorded on the driller's console and
on the log. Operators are often interested in detecting hydrogen sulfide for
personnel safety or to initiate treatment to prevent deterioration
of drilling equipment. Hydrogen sulfide in drilling mud has an
erratic and detrimental effect on the continuous gas detector. H2S
is easy to detect, however, and can be removed from the gas sample to
prevent adverse effects without influencing hydrocarbon detection. A
preset alarm indicator on the continuous H2S detector announces the
presence of potentially dangerous concentrations. A quantitative
determination of H2S in the air from any sample point may also be
made for personnel safety and recorded on the driller's console and
on the log.
Non-combustibles gases, such as helium, carbon dioxide and nitrogen,
can be detected. Carbon dioxide may be detected in conjunction with
logging for hydrocarbons on the continuous gas detector. By applying
the steam still reflux unit and gas chromatography techniques,
quantitative analyses for other non-combustible gases can be made.
MUD LOG EXAMPLES
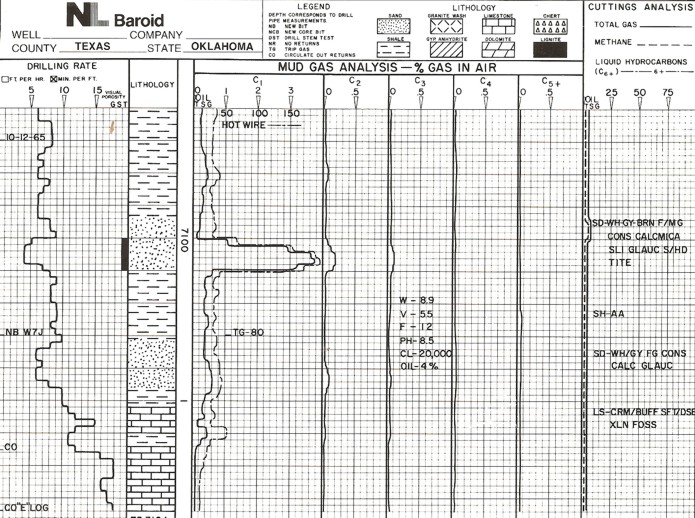
Mud log from early 1980's.
|