|
 PERMAFROST AND GAS HYDRATE BASICS
Permafrost exists in cold climates on land. Gas hydrates are
found in or below permafrost and under deep water coastal
regions. Gas hydrates are possible offshore the coastlines
of all continents, even in tropical regions. They cause difficulties when drilling to deeper
targets. Gas hydrates are reported to be a huge source of
natural gas, although the technically producible quantity is
much smaller.
Gas hydrate production was reported by the Russians in 1970
at a rate of
more than 10 mmcf/d in Siberia. It was called "solid gas" at
the time Canadian exploration wells
encountered them in the early 1970's and also reported some
of the difficulties in drilling and testing such intervals.
There are proven gas hydrate reserves on the North Slope of
Alaska and much evidence for hydrates all along East Coast
USA. Floating lumps of "fizzy ice" have been reported
offshore Oregon.
Much more recently, China has tested some gas hydrate wells
in the South China Sea and significant exploration effort
has been undertaken to define areas of interest. This may
account for some of the political tension in the area, as
China is looking for ways to obtain natural gas to reduce
reliance on coal fueled power plants.
PERMAFROST BASICS
Permafrost is defined as soil or rock that is permanently
frozen in all seasons for more than two consecutive years.
Permafrost covers much of the northern latitudes above 60
degrees and most of Antarctica.
Water in pore space freezes
when the temperature of the rock is below zero degrees Celsius (32 degrees F),
A phenomenon called freezing point depression (FPD) causes
the actual freezing temperature to be somewhat lower than 0
C. FPD is a function of pressure, salinity, and pore size,
and is usually about minus 1 to minus 2 degrees Celsius in
clean coarse grained sandstones. It can be as much as minus
8 C in very fine grained silts and shales.
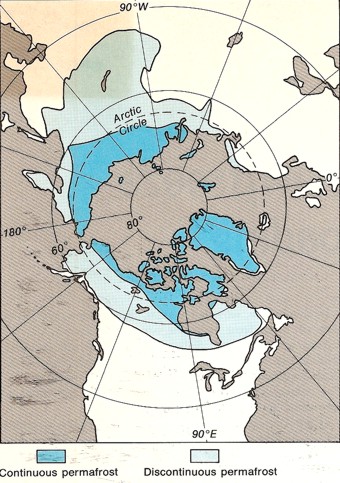  View from
the North Pole showing areas of continuous (blue) and
discontinuous permafrost (grey) View from
the North Pole showing areas of continuous (blue) and
discontinuous permafrost (grey)
Clay
bound water in shale does not freeze, so shale properties change
only slightly, depending on the amount of free water in the
effective porosity of the shale. Silty shales have more porosity
than pure shale and are more strongly affected by freezing.
Studies designed to locate the base of permafrost were
sponsored by the Geological Survey of Canada in the 1960's, 1970's, and
again in the early 1980's as more log data became available.
Permanent temperature recording systems using thermistors
equally spaced along a cable were installed in
numerous observation wells throughout the Arctic. These
surveys form the basis for static temperature data that is
still relied upon today.
Freezing alters the
physical properties of the composite rock. Ice has a very
high resistivity and high acoustic velocity compared to
water, thus resistivity and acoustic travel time logs are
changed significantly. Many other physical properties are
much less affected.
In a sandstone interval, the base of permafrost is easy to
pick on the resistivity log. In shales, it is much more difficult.
The base of permafrost is often picked at the base
of a frozen sandstone; this depth is called the base of ice-bearing
permafrost (IBPF).
PERMAFROST ON WELL LOGS
 The
depth to the base of permafrost varies considerably by location and
may reach 1500 meters or more. The base of permafrost is often
assumed to be the
depth below which the formation temperature exceeds zero degrees Celsius.
However freezing point depression can cause confusion since some rocks remain
unfrozen well below zero Celsius. Gas hydrates remain frozen
well above zero Celsius, so "base of permafrost is a bit of a moving
target. The
depth to the base of permafrost varies considerably by location and
may reach 1500 meters or more. The base of permafrost is often
assumed to be the
depth below which the formation temperature exceeds zero degrees Celsius.
However freezing point depression can cause confusion since some rocks remain
unfrozen well below zero Celsius. Gas hydrates remain frozen
well above zero Celsius, so "base of permafrost is a bit of a moving
target.
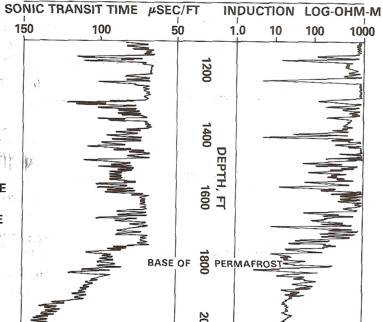
Long
spaced sonic log (left) and deep resistivity log (right) are
used to identify the base of frozen rocks, around 1800 feet
in this example, based on reduction in resistivity and
increase in sonic travel time. Frozen rock may contain
water-ice (permafrost) or gas hydrates (solid gas) or both.
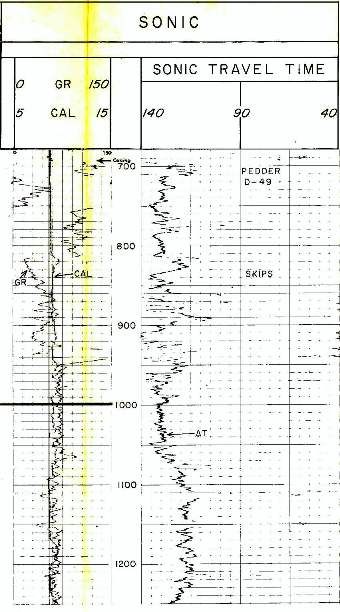
Example of long and
short spaced sonic logs in a permafrost section. The long
spaced curve shows the frozen rock velocity (as travel
time). This curve cannot be used for porosity calculations.
The short spaced curve shows the thawed travel time,
which can be used for porosity calculations after shale
corrections are applied. In shaly zones, the two curves give
similar values because the clay bound water does not freeze,
although any free water in the silt fraction of the shale
does freeze.
.
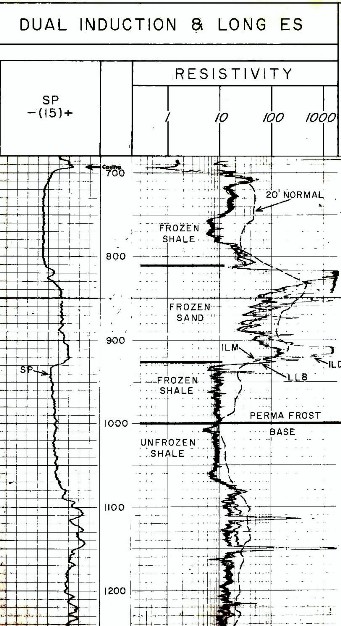 
An example of logs in permafrost:
standard induction and sonic logs, with a 20 foot Normal
resistivity curve from a modified ES Log. The 20 foot Normal
curve reads considerably deeper into the formation and is
less influenced by the thawed near-wellbore interval. All
resistivity curves show high values in frozen sands.The 20
foot nonmal reads higher than the induction log in frozen
shale. Only free water in the shale can freeze; clay bound
water cannot freeze. The sonic sees only the thawed
zone so it is not jelpful in identifyung base of permafrost.
GAS HYDRATE BASICS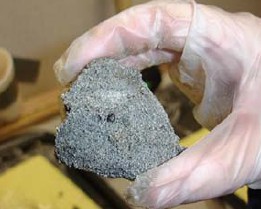
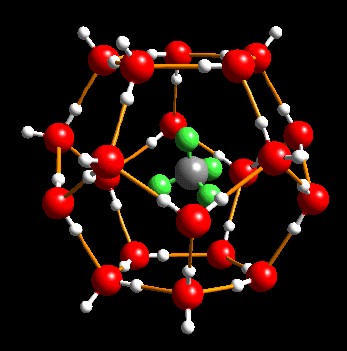
Gas
hydrates, also called clathrates, are mechanical mixtures of natural gas and water,
forming a crystalline solid in cold environments. These
mixtures are called "inclusion compounds". The water molecules
surround the gas molecules to form "cages" that trap the gas into
the crystals. There is no chemical bond between the water and the
gas, so the crystal is not a chemical compound.
Macro photo of a gas hydrate sample from a core (GSC Bulletin 585)
Gas hydrates are often found in or below permafrost zones on
land, or in deep water along continental margins. They can extend
below the base of permafrost, even though formation temperature is
above 0 C. Hydrates have been discovered or inferred along the
coastlines of all continents, even at temperate latitudes, and in
deep water trenches in the Pacific.
 The
quantity of gas in a hydrate does not depend on the depth, pressure,
or temperature of the reservoir, as is normally the case for natural
gas. Hydrates
can contain far more gas at shallow depths than a conventional
reservoir at the same depth. This can result in unexpectedly high
pressure in the wellbore as the hydrate thaws, with all the dangers
of blowouts and damaged equipment that this suggests. The
quantity of gas in a hydrate does not depend on the depth, pressure,
or temperature of the reservoir, as is normally the case for natural
gas. Hydrates
can contain far more gas at shallow depths than a conventional
reservoir at the same depth. This can result in unexpectedly high
pressure in the wellbore as the hydrate thaws, with all the dangers
of blowouts and damaged equipment that this suggests.
A good
description of gas hydrates is contained in "Naturally Occurring Gas
Hydrates in the Mackenzie Delta", C. Bily and J. W. L. Dick, CSPG
Bull., 1974.
Gas hydrate
crystal with water molecules (red)
trapping methane molecules (grey) (USGS image) 
The various
phases of water, ice, hydrates. and free gas are determined by a
phase diagram, which depends on the specific gravity of the gas,
salinity of the water, temperature, and pressure. The latter two
factors are functions of depth, so the phase diagrams are often
plotted versus depth, using assumed pressure and temperature
gradients. Schematic examples are shown below.
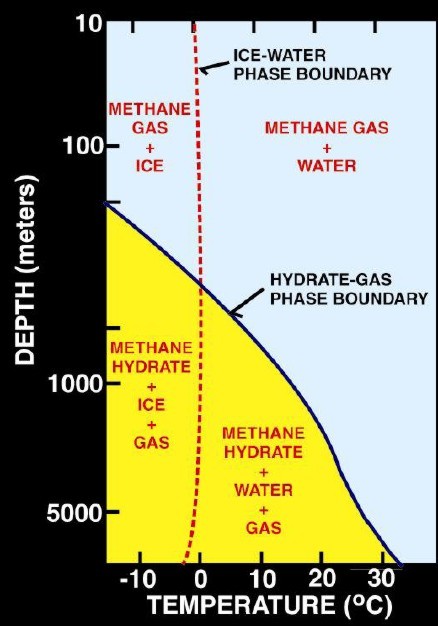
Left:
Schematic phase
diagram for water, water-ice, gas hydrates. and free gas.
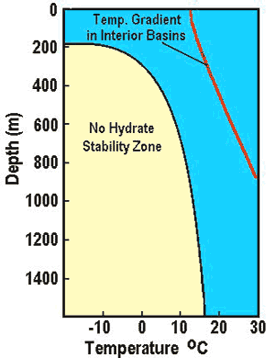
Right: Phase diagram
with temperature log, showing a situation where temperature is too
high to permit hydrate formation.
(USGS images)
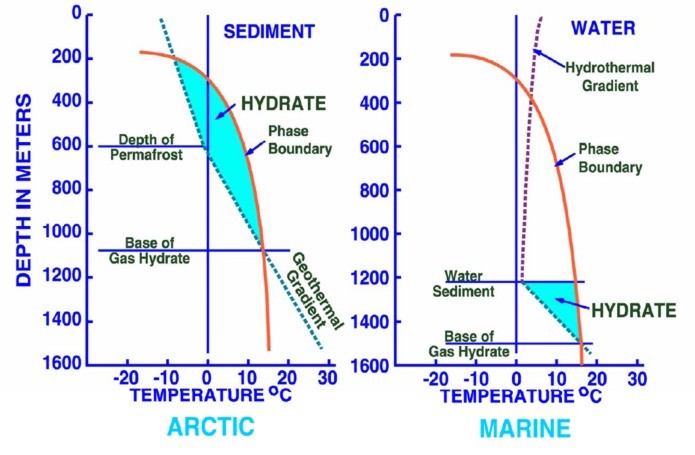
Left:
Phase diagram for on-shore situation where temperature is low enough
to permit hydrate formation (blue shading),
Note base of permafrost at 0 C isotherm. Right:
Deep water
off-shore has distinctly different temperature profile, so hydrates
can form near seafloor in very recent sediments (blue shaded
area). Higher specific gravity and higher salinity will move the
hydrate phase boundary (red line) to the right, increasing the depth
at which hydrates may form.
(USGS image)
An
increase in temperature increases the pressure required to form
hydrates, while small percentages of ethane or propane lower the
hydrating pressure considerably. Hydrogen sulfide and carbon dioxide
also decrease the required pressure.
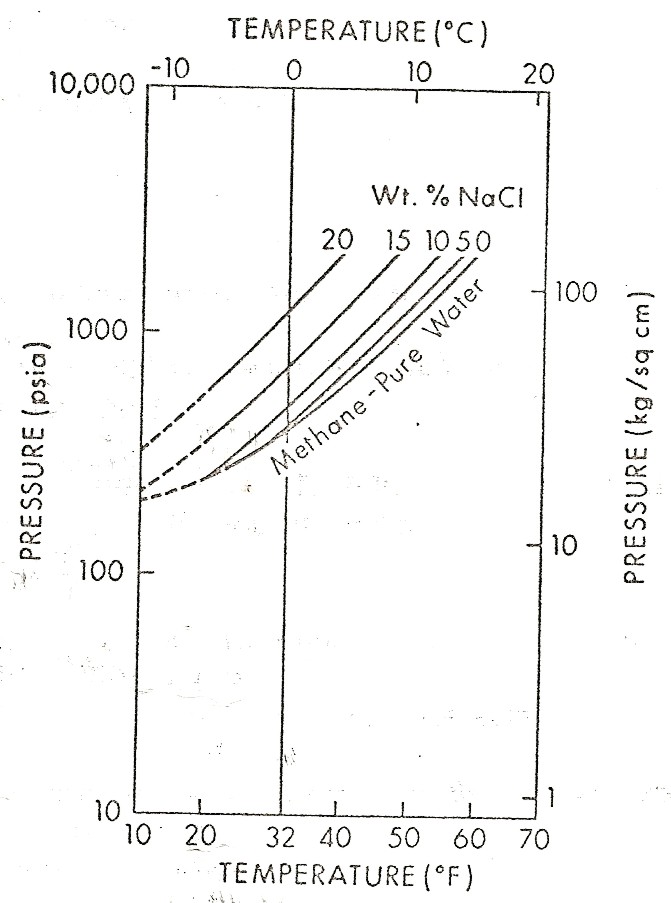
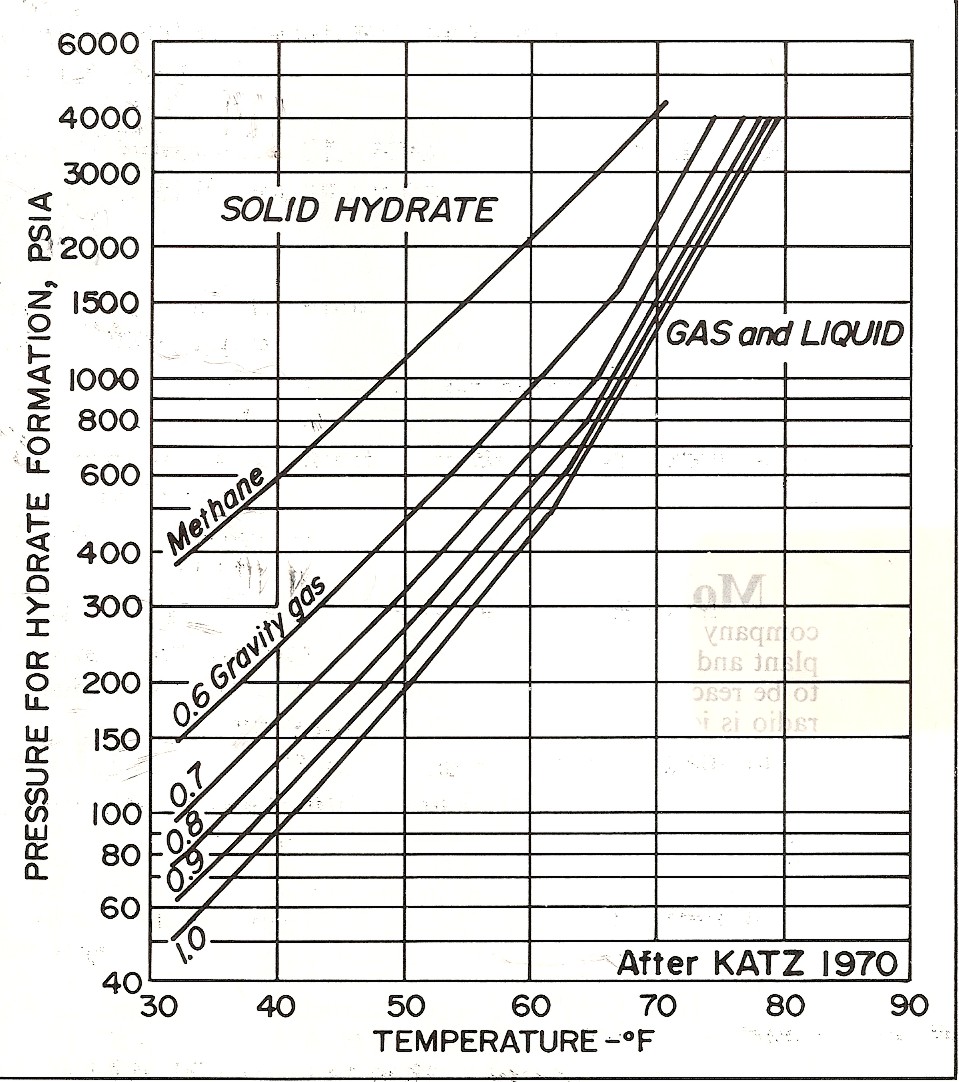
Left:
Graph showing effect of salinity on hydrate phase. Right: Effect
of gas specific
gravity on hydrate phase.
(source: Natural
Gas Engineering Handbook, D.Katz, 1959)
DRILLING and Production Hazards IN Gas Hydrates
Drilling into permafrost and gas hydrates, or to deeper targets
below them, is fraught with problems. Thawing of permafrost in
otherwise unconsolidated sediments will generally mean a large,
washed-out borehole, with poor logs. Drilling with a chilled mud
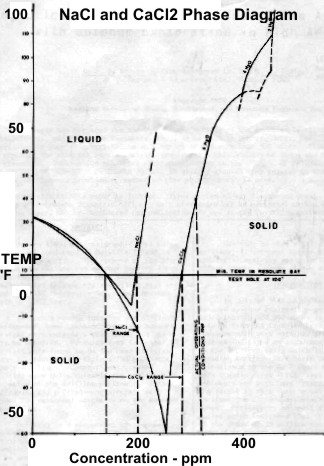
system has been attempted, but this has its own hazards - if NaCl or CaCl2 are used to prevent freezing of the mud, it may
still freeze if borehole temperature falls outside the liquid
phase diagram for the mixture.
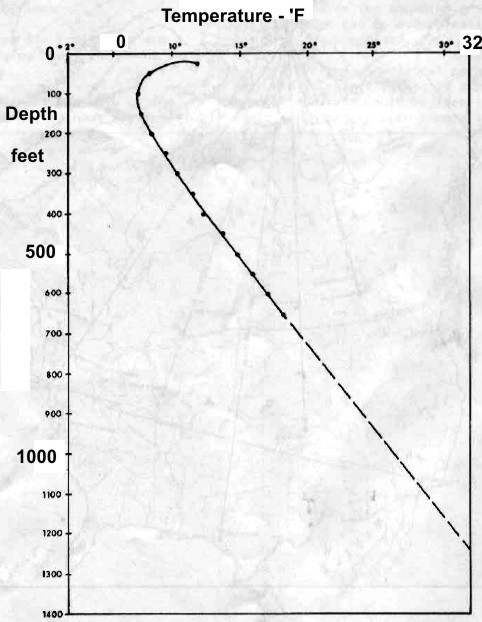
Left:
Permanent temperature survey in observation well #20 at
Resolute Bay, Nunavut showing base of permafrost at about 1200
feet at 32 F. Right: Phase diagram for NaCl and CaCL2 showing
salt concentration "window" for the coldest wellbore temperature
at Resolute Bay (and similar latitudes). Getting stuck in the hole
with oversaturated salt mud is really embarrassing. (Source: Marshall and Crain, AIME, 1970)
Thawing of gas hydrates generates gas at pressures well above
those expected at these shallow depths. It may be impossible to
raise mud weight sufficiently to prevent a blowout, so chilled
mud and a quick casing job are indicated. If a well
is cased and cemented, that gas pressure may cause wormholes in
the cement, leading to a permanent leak to surface as long as
borehole temperature is higher than the hydrate stabilization
temperature. High quality cement jobs in large, cold boreholes
are notoriously difficult.
Continued thawing may cause casing collapse or rock subsidence,
with loss of wellbore integrity. Successive thaw-freeze cycles
aggravate these conditions and may cause vertical expansion of
the rocks during refreezing..
The
typical production scheme proposed for gas hydrate wells is by
depressurization. During production, wellhead control is
difficult due to the high pressure and cold temperatures.
Hydrates may reform in the plumbing. Produced water must be
lifted and disposed of before it refreezes. Thawing allows fines
migration which annoys pumping and compression equipment. Some
experimental production methods involve the addition of heat or
methanol to release the gas. Heat may affect non-gas bearing
intervals in the permafrost, leading to casing collapse or
movement.
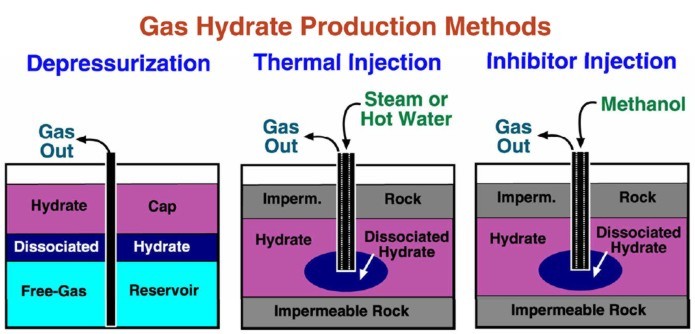
Proposed methods for gas hydrate production. (USGS image)
On
the North Slope of Alaska, the gas hydrate issue is
further complicated by the presence of oil and free gas with
hydrates in various combinations.
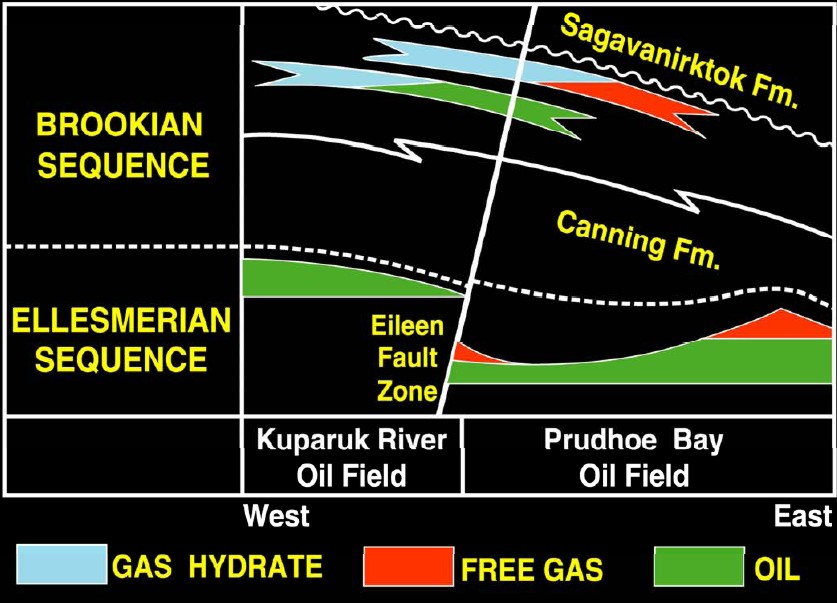
Gas hydrate, free gas, and oil distribution Eileen area, North
Slope, Alaska. (USGS image)
Deepwater offshore hydrate production has its own issues, and
although a huge resource is postulated, I am not aware of any
intentional attempts to produce it. No wonder shale gas is so
popular!
log analysis IN Gas Hydrate WELLS
 The
excess hydrogen in gas hydrates compared to water or water ice,
1.10 versus 1.00 for water, and 0.90 for water-ice, makes neutron
porosity logs read
high in gas hydrates. The lower density of ice and hydrate, 900 kg/m3 versus
1000 kg/m3 compared to water, makes the density porosity read too high also. However, thawing near
the borehole will reduce this effect and it is seldom seen. Instead
the zone often looks like a normal water-invaded gas sand. If
thawing is deep enough, gas crossover could occur. The
excess hydrogen in gas hydrates compared to water or water ice,
1.10 versus 1.00 for water, and 0.90 for water-ice, makes neutron
porosity logs read
high in gas hydrates. The lower density of ice and hydrate, 900 kg/m3 versus
1000 kg/m3 compared to water, makes the density porosity read too high also. However, thawing near
the borehole will reduce this effect and it is seldom seen. Instead
the zone often looks like a normal water-invaded gas sand. If
thawing is deep enough, gas crossover could occur.
Short
spaced sonic logs reading the thawed zone can be used to
calculate porosity, but compaction and gas corrections will be
required. Long spaced sonic logs reading the frozen zone are
difficult to analyze for porosity due to an unknown amount of
excess (unfrozen) water along with the ice or hydrate.
Logging while drilling is recommended as there is less borehole
rugosity and less thawing. Resitivity, shear and compressional
sonic, density, neutron, and gamma ray are the usual logs
required. If chilled invert mud is used, open hole logging may
be successful.
Freezing of water causes salt rejection, leaving some excess
unfrozen water with moderately high salinity. Higher salinity
water tends to increase the SP deflection but the higher
resistivity of the ice tends to reduce SP deflection. The net
result is low SP deflection in frozen intervals. SP in the
unfrozen intervals behaves normally.
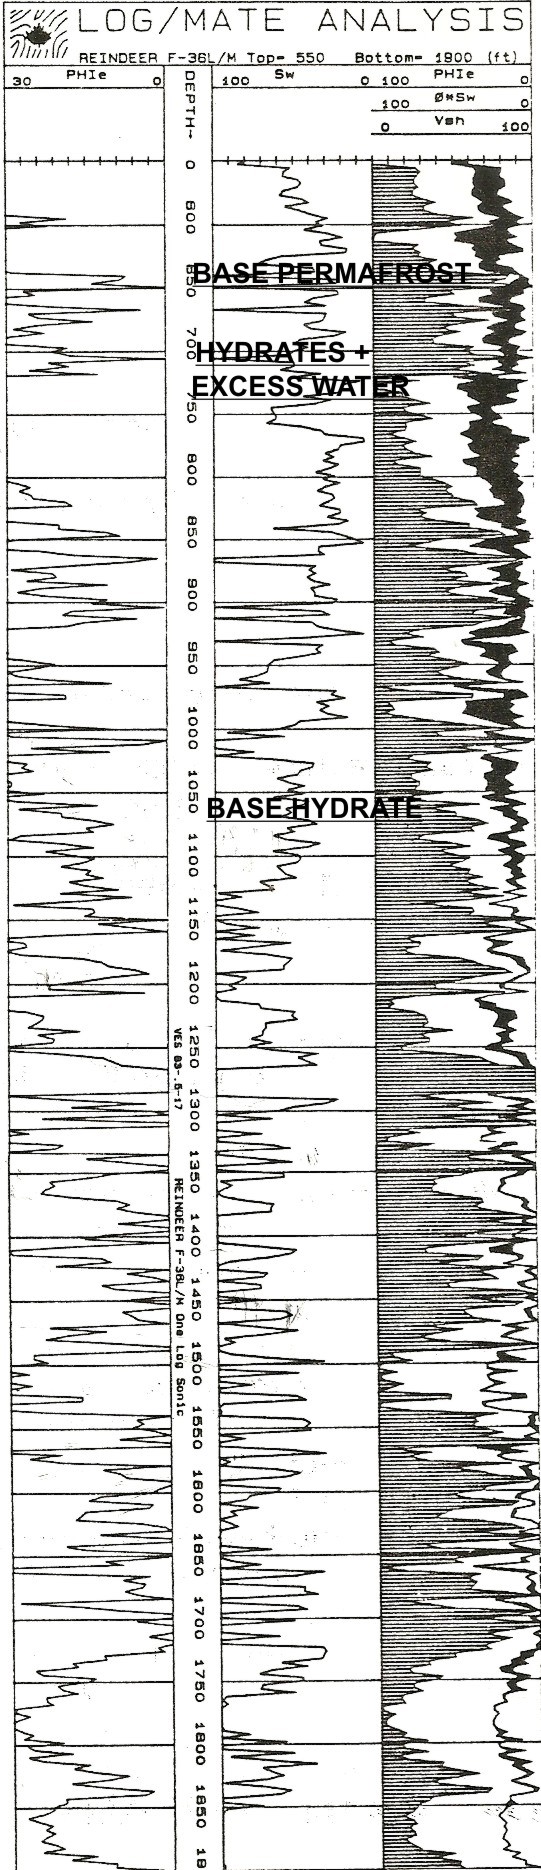
Quantitative
log analysis of permafrost -
gas hydrate interval in Mackenzie Delta,
run in 1983 using standard porosity and
Archie saturation models.
See
explanation below
Resistivity will read high values in both water ice and gas hydrate
in sand sequences; shales will show typically low resistivity with
moderate gamma ray values. Clay bound water does not freeze, so
shale resistivity does not incresase much when frozen.
A long spaced sonic will read the frozen
rock velocity (or travel time) but short spaced sonics will see the
thawed zone velocity. Many hydrate zones are poorly consolidated, so
caliper logs may show large washouts as the rock thaws. In large or
rough boreholes, both density and sonic logs may show large spikes
or noise.
Neither resistivity nor porosity logs are very helpful in
distinguishing gas hydrates from water ice. The best indicator is
the gas mud log because large quantities of disassociated gas are
released as the hydrate is thawed. No significant gas is released
from water ice. Free gas and even oil are also possible and gas mud
logs will show less than in a hydrate zone.
Quantitative log analysis is complicated by the inability of
standard models to differentiate between water ice and gas hydrates.
Free gas and gas hydrate (if thawed deeply enough) can be distinguished by gas crossover in cleaner sands.
By
treating ice and hydrates as if they were hydrocarbons, standard
porosity and Archie-type saturation models can give an estimate of ice plus hydrate content (black shading in
Track 3) and free water (white shading). In this model:
1: Shydr = 1 - Sw provided zone is hydrate bearing and not
water-ice.
Standard deterministic or probabilistic multi-mineral models using
quartz, clay, ice (water ice or hydrates) and free water will also
work. In these models:
2: PHIe = Vice + Vwtr
3: Shydr = Vice / PHie provided the zone is
hydrate bearing and not water-ice.
If a
nuclear magnetic resonance log is run, the effective porosity from
this log is the water filled porosity. Ice and hydrates are not
seen. Thus:
4:
PHInmr = BVI + BVM
5: SWnmr = PHInmr /
PHIe
6: Shydr = 1 – SWnmr
Where:
BVI = bulk volume irreducible from NMR (fractional)
BVM = bulk volume moveable from NMR (fractional)
PHIe = effective porosity from conventional logs (fractional)
PHInmr = effective porosity from NMR (fractional)
Shydr = hydrate saturation (fractional)
Sw = water saturation (fractional)
Vice = volume of ice or hydrate (fractional)
Vwtr = volume of water (fractional)
The
base of permafrost is chosen by a nearby permanent temperature log
(around 650 feet in this example). Black shading below this depth
down to 1000feet is gas hydrate and there may be gas hydrates in the permafrost zone.
Since salt rejection increases water salinity in the excess water,
the water resistivity is unknown and variable, so the quantities of
ice, hydrate, and excess water are not very accurate. The mud
gas log is vital.
In
older wells, the sonic log was often very noisy and seismic
reference surveys were used to determine acoustic velocity. The
beginning of low velocity would indicate the base of permafrost or
base of gas hydrates, or shales.
These surveys were superseded by crystal cable
surveys, the forerunner of the vertical seismic profile, which would
be used today for this purpose. VSP's and their predecessors can be
run in cased holes provided the shot point is far enough from the
wellbore, otherwise the velocity derived from the survey will be
that of the casing. A good description of the use of
this tool is "Permafrost Investigation by Crystal Cable Surveys,
Mackenzie Deltas", I. H. Wallace and A. J. Stuart, CSEG, 1975, from
which the following two illustrations were taken.
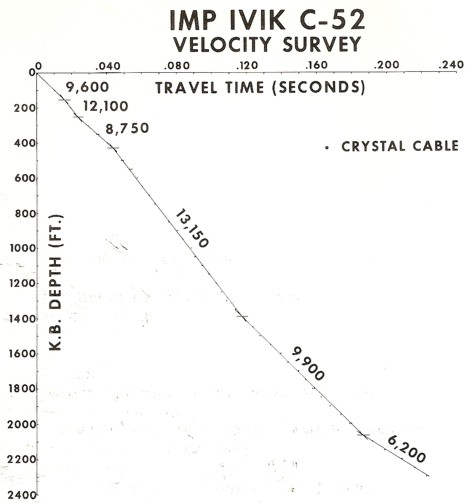
Crystal cable survey time vs depth plot with interpreted velocity
values. Base of permafrost could be as shallow as 1400 feet or as
deep as 2000 feet.
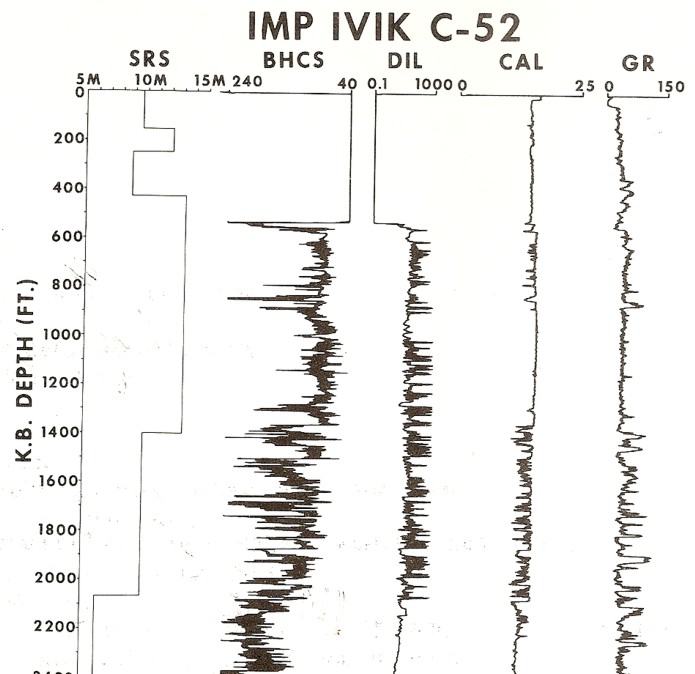
Crystal cable survey vs depth with other log data. Base of
permafrost is still unclear due to large, washed-out borehole. Gamma
ray needs borehole corrections to make shales stand out better.
Sonic is in general agreement with SRS velocities but induction log
does not show continuous high resistivity expected for a sand
interval, so much of the interval is probably shale or shaly sand.
Permafrost base is probably near 2000 feet because there is only low
resistivity below this depth.
This log clearly illustrates a severe case of rock alteration due
to permafrost. In this case, the short spaced sonic sees the thawed
zone and the long spaced tool see the frozen zone. Porosity is
derived from the short spaced log, with appropriate shale and
compaction corrections, but seismic velocity must be taken from the
long
spaced log.
Gas Hydrate
VOLUME IN PLACE
Empirically,
the ratio of water to gas necessary to form a hydrate is as follows:
Excess
Hydrogen
1. Methane CH4.6H20 4/12 = 33%
2. Ethane C2H6.8H20 6/16 = 37%
3. Propane C3H8.17H20 8/34 = 23%
The
volume of hydrocarbon in a gas hydrate is a function of the hydrocarbon
type only. Water saturation is meaningless. The
ratio of gas to water would range from 433 scf/bbl for propane
to 1230 scf/bbl for methane.
This
is equivalent to 170 cubic feet of methane per cubic foot of
pore space (or 170 m3 per cubic meter of pore space) at standard
temperature and pressure and 60 cubic feet of propane
per cubic foot of pore space, regardless of depth of burial.
Gas in
place is derived by converting pore volume to gas volume:
7: PV = (PHIe * THICK
8: HPV = PV * Shydr * KG0
9: GIPhydr = KV3 * HPV * AREA
Where:
AREA = reservoir area (acres or m2)
HPV = hydrocarbon volume (feet or meters)
PHUe = effective porosity (fractional)
PV = pore volume (feet or meters)
Shydr = hydrate saturation (fractional)
Sw = water saturation (fractional)
GIPhydr = gas in place as hydrates (mcf or m3)
KV3 = 43.56 for English units
KV3 = 1 for Metric units
KG0 =164 for methane
KG0 = 60 for propane
NUMERICAL
EXAMPLE:
1. Assume the following data:
PHIe = 0.35
Sw = 0.20
Hydrate is methane
THICK = 300 feet
KV3 = 43.56
KG0 = 164 scf/scf
AREA = 640 acres
HPV = 0.35 * 300 * (1 - 0.20) * 164 = 13776 ft
GIPhydr = 43.56 * 13776 * 640 / 1 000 000 = 384 Bcf/section
Gas Hydrate EXAMPLES
The original Mallik L-38 well in the Mackenzie Delta was drilled in
1972 and discovered a major gas hydrate and free gas interval. The
well sits on a large structure and was suspended pending construction of the Mackenzie Valley
Pipeline. In 2002, an international
joint government, industry, academic consortium (Mallik 2002 Gas
Hydrate Production Research Well Program) was formed to
investigate alternate methods of producing gas hydrates, using this
structure as a test platform. Observation wells were drilled and various
production schemes have been tested. A 34 GB data set can be
downloaded from the National Research Council (Canada) website as
Geological Survey of Canada Bulletin 585.
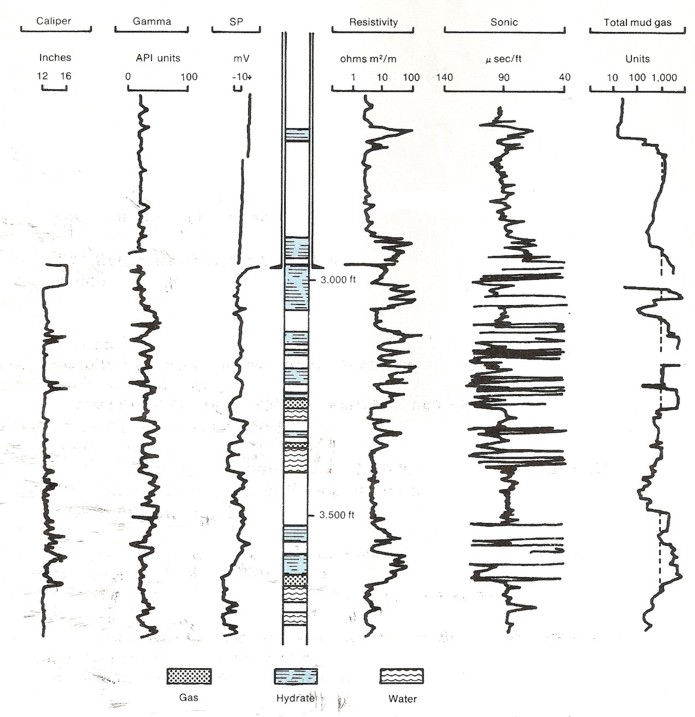
Original wireline logs and gas log for Mallik L-38. Compare location
of hydrate zones with log
response and gas log showing gas hydrates and free gas below 3000
feet. Permafrost base is around 1900 feet, well above this log
segment. (USGS image, redrawn from Bily and Dick, 1974).
The 2002 Production
Research Project drilled additional wells near Mallik L-38 to test
various production schemes and evaluation techniques. The logs and a
computed result are shown below.
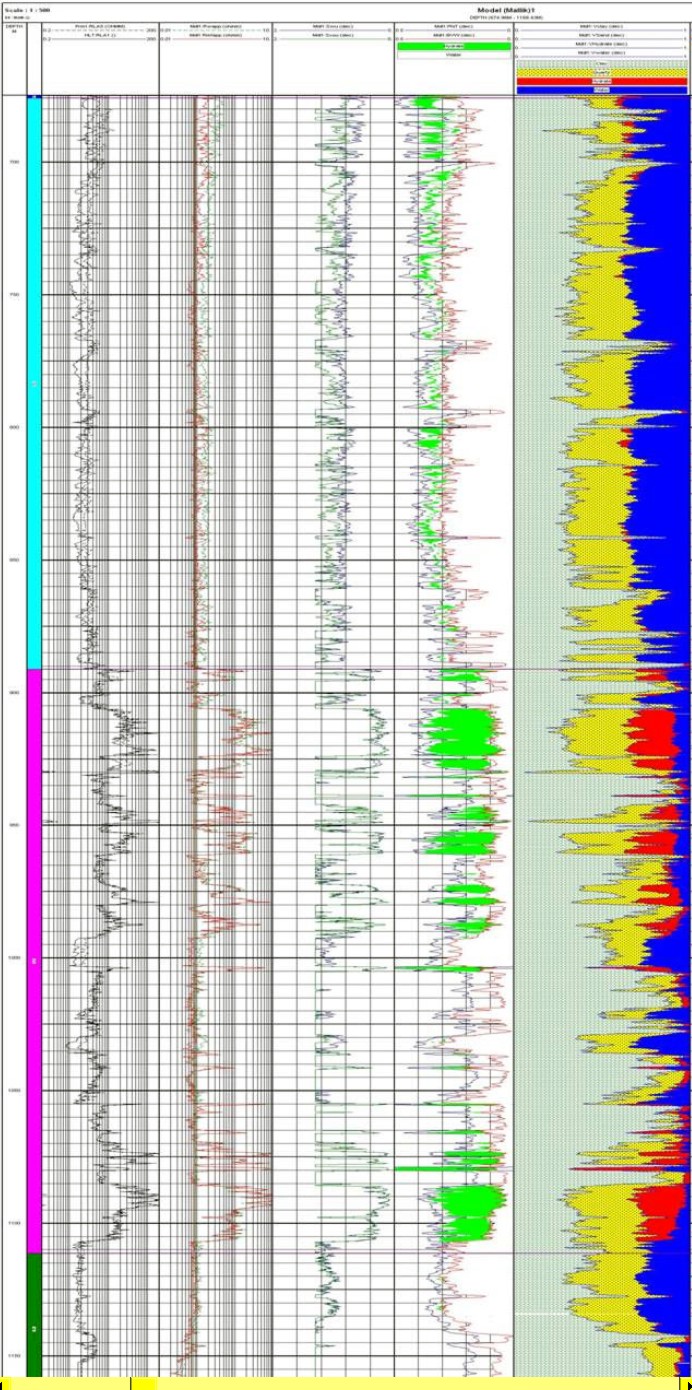
Raw logs and computed results for
Mallik 5L-38 drilled
in 2002. Logs are (from left to right) array laterolog, array
induction, shear and compressional sonic, density and neutron with
gas crossover shaded green, computed results with clay, quartz
(yellow), hydrate (red) and water (blue). Note depths are in meters
and cover approximately the same interval as the Mallik L-38 logs
shown above.
The above
illustration is from "FORMATION
EVALUATION OF GAS HYDRATE BEARING
SEDIMENTS" by Frank Williams, Mike Lovell, Tim Brewer,
Christian Buecker, Peter Jackson, Ameena
Camps, SPWLA, 2008.
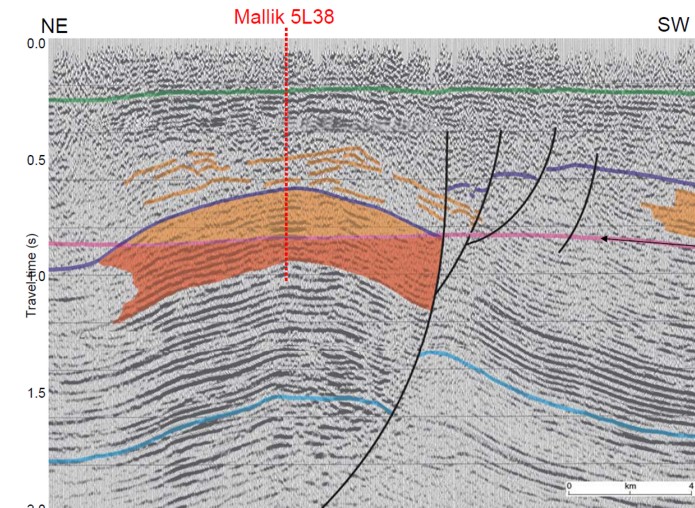
Seismic section on Mallik structure, shaded area shows gas hydrate
over free gas. (USGS image)
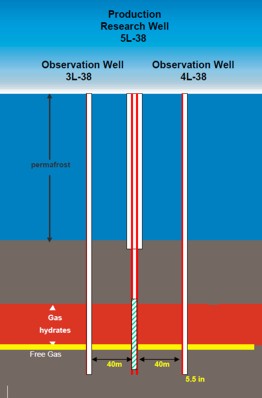
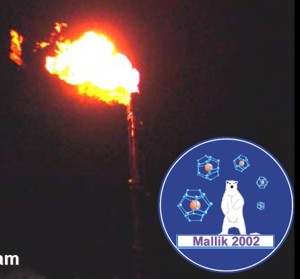
Left:
Schematic layout of experimental wells at Mallik L-38,
Right: Gas
flare during test of Mallik L-38 and Mallik Project logo. This project is an international joint government,
industry, academic consortium to investigate alternate methods of
producing gas hydrates. (GSC
Bulletin 585)
|