This page describes wireline formation tester tools profiles, in the order of their appearance over the years. This presentation style provides insights into tool evolution, and a specific tool’s capabilities and limitations. You will find most these tool types in your well files – here’s your chance to learn more about them.
Formation testing on wireline was
developed in the mid 1950's to provide a faster, safer and
less expensive method of formation evaluation than
conventional drill stem testing (DST).
The earliest formation tester (FT) used an electro-mechanical-hydraulic pad system to obtain good contact with the borehole wall, then a 2 bullet perforation charge was fired at a single depth point. This created a pathway for fluids to flow from the reservoir into a chamber at the base of the tool. The first formation tester could only be operated in uncased holes. Hydrostatic, shut-in, and flowing pressures were measured and recorded as the test proceeded. During the flow period, formation fluids flowed into a collection chamber. When the test was completed, the chamber was sealed at maximum pressure and the tool brought back to the surface. Built-in “Get-away” guns were fired in the case of differential sticking. The recovered sample was analyzed in the lab to determine the fluid properties. Shut-in pressures were plotted versus depth to determine pressure gradients, gas-oil, gas-water, and oil-water contacts, as well as the location of over- and under-pressured reservoirs. Over the years, tools such as the Formation Interval Tester (FIT), the Reservoir Description Tool (RDT) and the Modular Formation Dynamics Tester (MDT) chart the evolution of wireline formation testing. Each service company devised their own tools and trade names. Tool development was driven by the need to acquire single phase, uncontaminated samples of reservoir fluid returned to surface. For example, newer tools take multiple samples and allow the operator to pump fluid from the reservoir instead of relying on natural flow rates, permitting the tool to bypass the sample collection chamber until a representative sample is obtained. This reduced the impact of mud filtrate contamination on the final collected sample. Along with pressure tests and gradients, lab analyses of PVT relationships, GOR, viscosity, and composition are the foundation for planning production and processing facilities. The following overview of tools shows how wireline testing has evolved to provide a clearer picture of reservoir conditions.
Innovations in Wireline Fluid
Sampling,
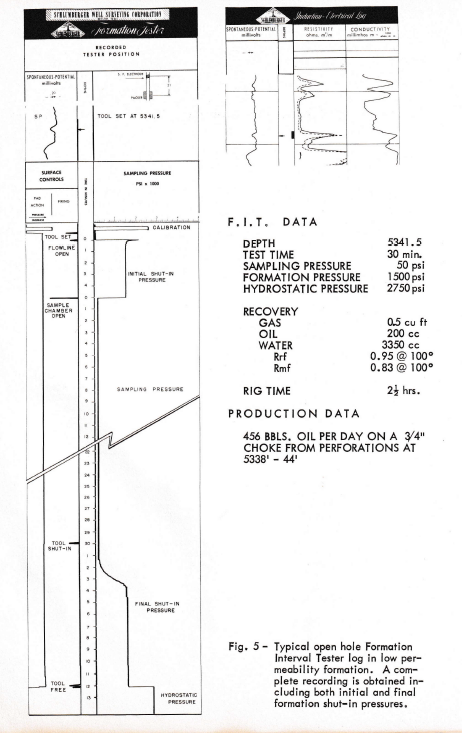
The FIT simultaneously detonated two perforations at an 8.5” spacing, testing a 1 foot interval of formation rather than a single depth point. The 4.4” slim tool was rated to penetrate ~3” of steel while the regular tool, with it’s larger charge size, was able to penetrate over 4” of casing, or up to 12” of formation. Dual packers sealed the FIT to the formation wall, plus an automatic seal valve closed the sample chamber in the event of seal failure. Like the FT, several chamber sizes were available: 1, 2 ¾ or 5 ½ gallon. The deeper penetration, plus better sealing function increased the chance of recovering fluids in low permeability, hard formations and opened up formation testing for use in cased holes. The FIT was not recommended for use in unconsolidated formations.
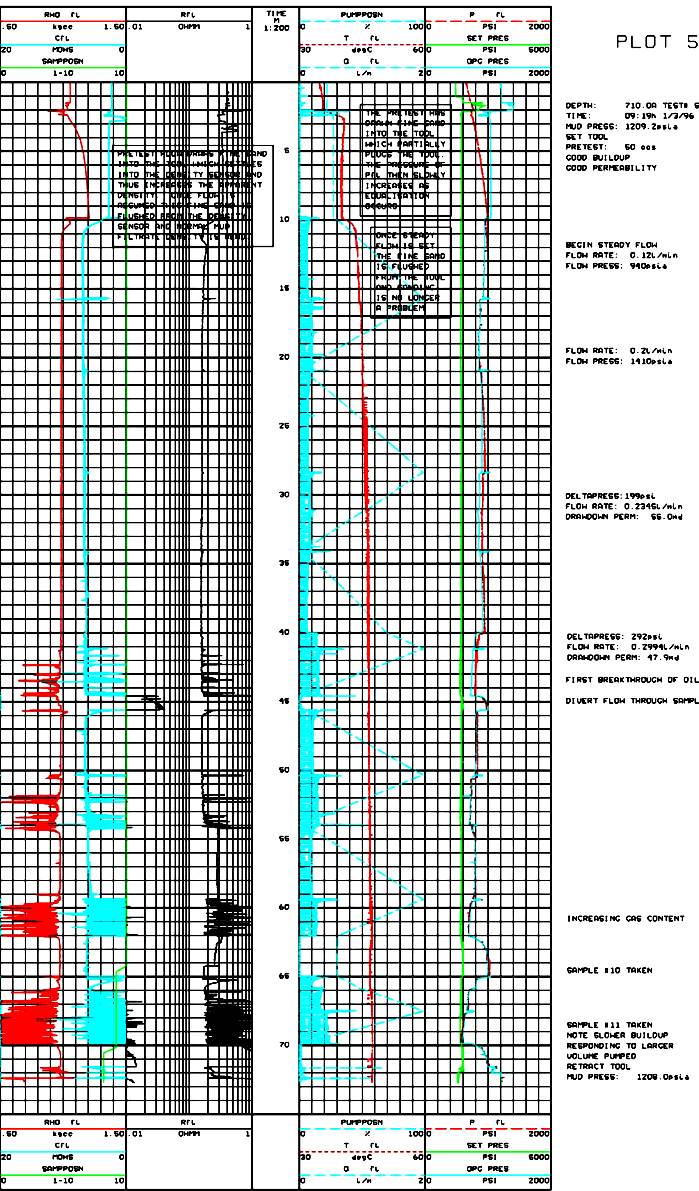
In addition the FET contains two Quartz Pressure Gauges which have an accuracy of 0.01 psi. This in conjunction with the tools pumping ability allows for accurate shut-in pressures (SIPs) to be obtained with controlled draw downs. The FET pump can be manually controlled enabling any user defined draw down volume to be acquired, lowest being 1cc. In addition the FET has the ability to reverse pump, that is pump fluids from the borehole into the formation. The proven benefit of reverse pumping is the tool’s ability to “pump off” the formation, beneficial for situations where the tool has been set for long periods of time. The FET has been designed such that if there is a loss of tool power for whatever reason the tool will automatically retract (unset itself from the formation) enabling it to be retrieved via the wireline cable. During the operation of the tool, the operator is able to give the following information to the client: For Pretests; · Draw Down Pressure (DDP) in PSIA, · Draw Down Volume in cc, · Shut In Pressure (SIP) in PSIA, · Fluid temperature in °C,
For Constant Flow Tests (for every litre pumped); · Resistivity in ohm/m, Conductivity in mho/m, · Density in g/cc, · Temperature in °C, · Reservoir pressure in PSIA, · Flow rate in L/min, · and Permeability in mDarcy.
For each sample taken; · Resistivity in Ohm/m, · Conductivity in mho/m, · Density in g/cc, · Temperature in °C, · Reservoir pressure in PSIA, · Flow rate in Litres/min, · Permeability in mDarcy, · Pressure at surface in PSIA, · and Volume captured at surface in cc.
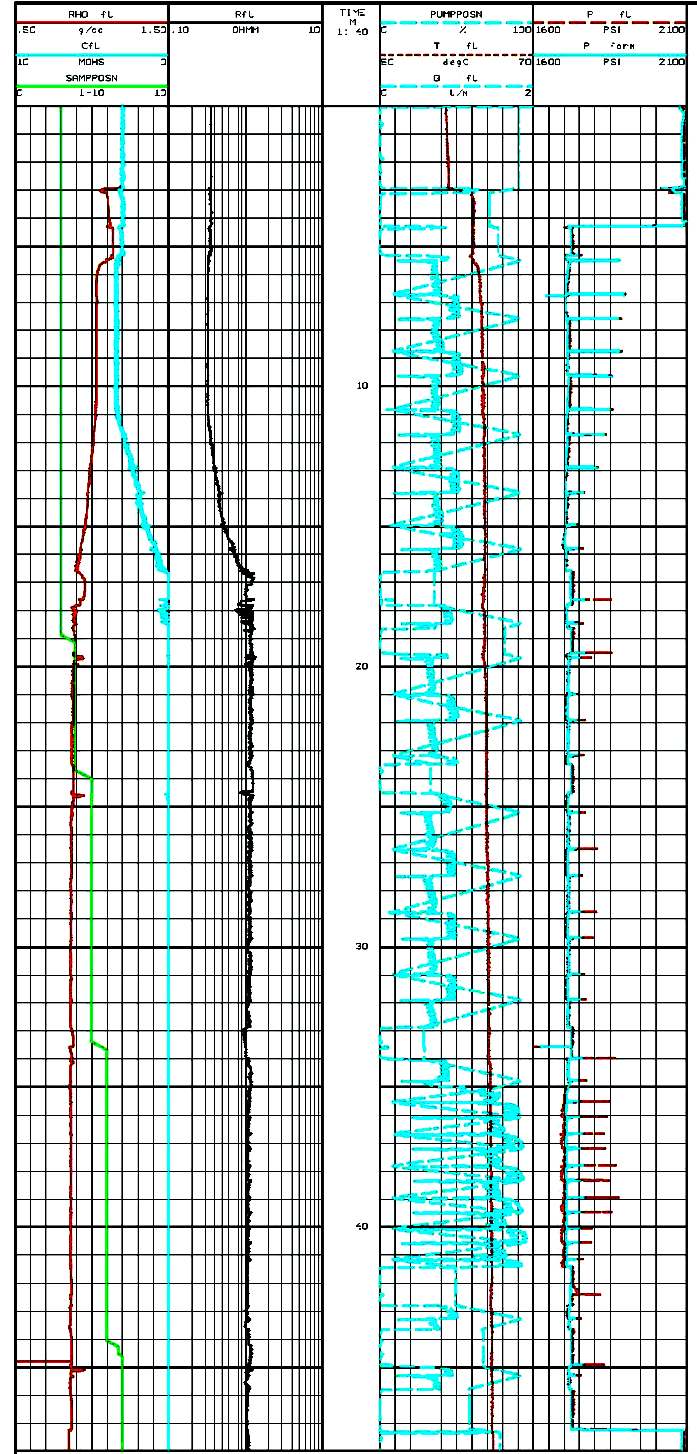
The primary purpose of a constant flow test is to ensure that an uncontaminated sample of the Reservoir fluid or gas is flowing through the tool. During a constant flow test, for every litre pumped the resistivity, conductivity and density of the hydrocarbon or water is monitored in search for a “breakthrough”. Meaning, when all the mud filtrate has been pumped from the reservoir and the actual uncontaminated hydrocarbon or water is present. When this occurs there is a noticeable difference in the FET’s sensor readings which corresponds to the properties of the hydrocarbon or water expected. It is at this stage that a sample is taken upon the client’s request. Therefore, a constant flow test must be performed before a sample is taken to ensure a representative (uncontaminated) sample is taken. Secondarily, a constant flow test may be performed to gather the properties of the hydrocarbon or water present after breakthrough in terms of resistivity, conductivity and density. This may be used to confirm the depth pressure gradients as well as reservoir contact depths. In addition to this, a constant flow test also results in the flow rate and permeability of the fluid to be determined. Reservoir fluid samples are captured within the multisampler component of the FET. The configuration of the multisampler depicts the quantity and volume of samples captured. The FET has the capability of attaching a PVT sampling assembly to the bottom of the tool to capture 2 x 524.4cc formation fluid samples per run. Before any pretests are performed the tool packer must be set at the correct depth. This is achieved via a gamma ray plot. A gamma ray plot is printed and correlated with an existing gamma ray plot and the packer depth adjusted accordingly. The requirement for the gamma ray correlation is that the FET Software must be connected to the logging unit’s depth system. The FET Software can connect to the logging unit’s depth system via an RS-232 serial port.
Once the down-hole job is completed,
the end result in the FET Software is a graphical log illustrating
all sensor measurements over time for pretests, constant flow tests,
and samples captured. The client receives a hardcopy and a data file
in LAS format. Examples are shown at the end of this webpage.
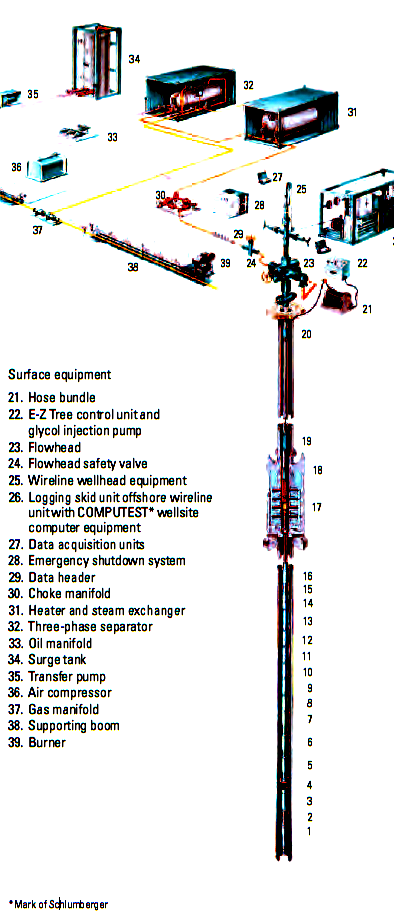
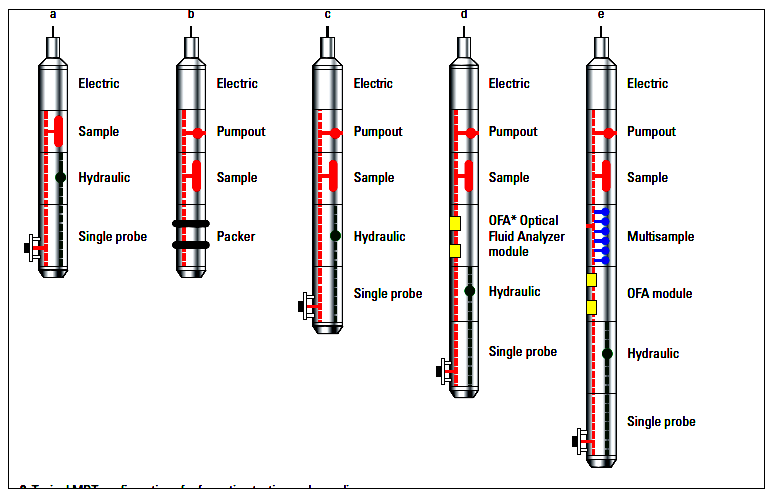
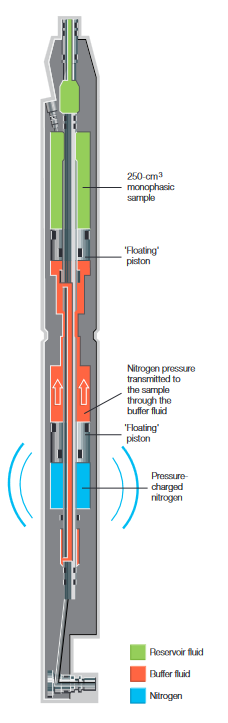
The operator can choose a Single or Dual-probe module depending upon the answers required. A basic configuration for pressure, vertical permeability and sampling, could combine several Single-probe assemblies with six sample chambers set at the base of the tool. The Single-probe module consists of packer and telescoping backup pistons, pressure gauges, sensors for fluid resistivity and temperature plus a 20 cc pretest chamber. The module has a strain gauge and a CQG (Crystal Quartz Gauge) that allows monitoring of drawdown from surface. When used in tandem with the Dual-probe module, pressures are measured by both the Single and the Dual-probe, the latter featuring two probes mounted back to back on the same block, at 180 degrees, giving horizontal permeability. The multi-probe configuration provides data for near wellbore permeability anisotropy, or running interference testing to assess communication between adjacent horizons. The Probe/Dual-Packer Module, with two inflatable packers isolating an interval of 3-11’, ensures that fluid can be withdrawn at a greater rate without dropping below the bubble point. The larger interval results in a radius of investigation up to 10 feet into the reservoir for better permeability estimates. The Flow Control Module allows formation fluid to flow into a 1 liter pretest chamber, useful for tests which require a controlled flow rate. A Single-Phase Multisample Chamber used with the Multi-Sample Module enables monophasic fluid collection for PVT analysis. The sample is pressurized by Nitrogen, to stop phase alterations due to temperature induced pressure drop as the chamber is returned to surface.
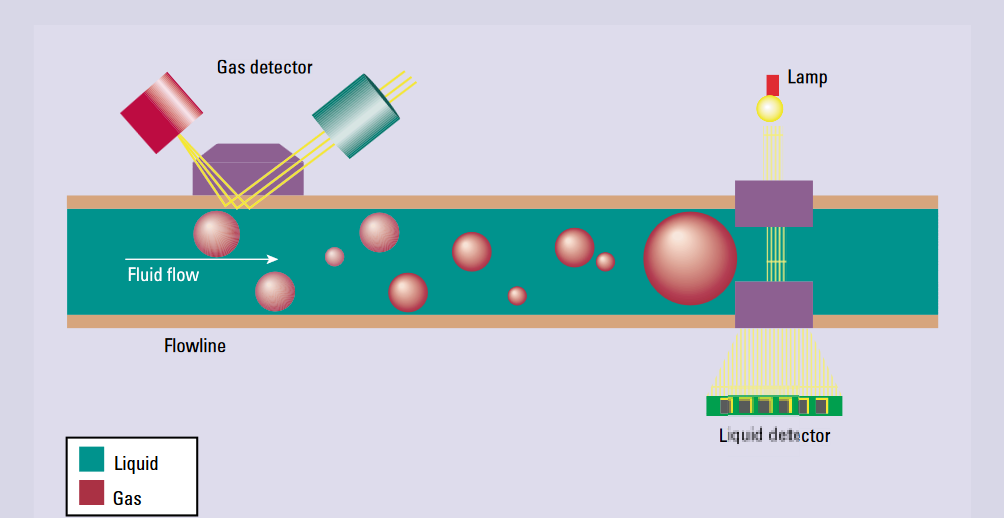
Possibly the most innovative module is the Live Fluid Analyzer, used to pinpoint when the fluid becomes least contaminated by filtrate, particularly that of Oil Based Muds (OBM), or in cases of deep invasion. Using a near-infrared spectrometer, the LFA (or Optical Fluid Analyzer - OFA) measures optical properties of the fluid in the flowline. Gas is detected by measuring polarized light reflection. When optical readings indicate that the amount of mud filtrate has stabilized at a low value, the sample is taken. The tool also discriminates between oil and water, and crude oil versus OBM. As oil exploration requires ever greater finesse, tools such as MDT Forte and MDT Forte-HT have been developed for use in rugged and high temperature environments. Rugose/unstable boreholes, thinly laminated formations and sampling low mobility/heavy fluids can be tested using the Saturn 3D Radial Probe system. With multiple self-sealing ports, this tool provides temporary mechanical stabilization of the reservoir walls and a pressure differential great enough to mobilize heavy oil.
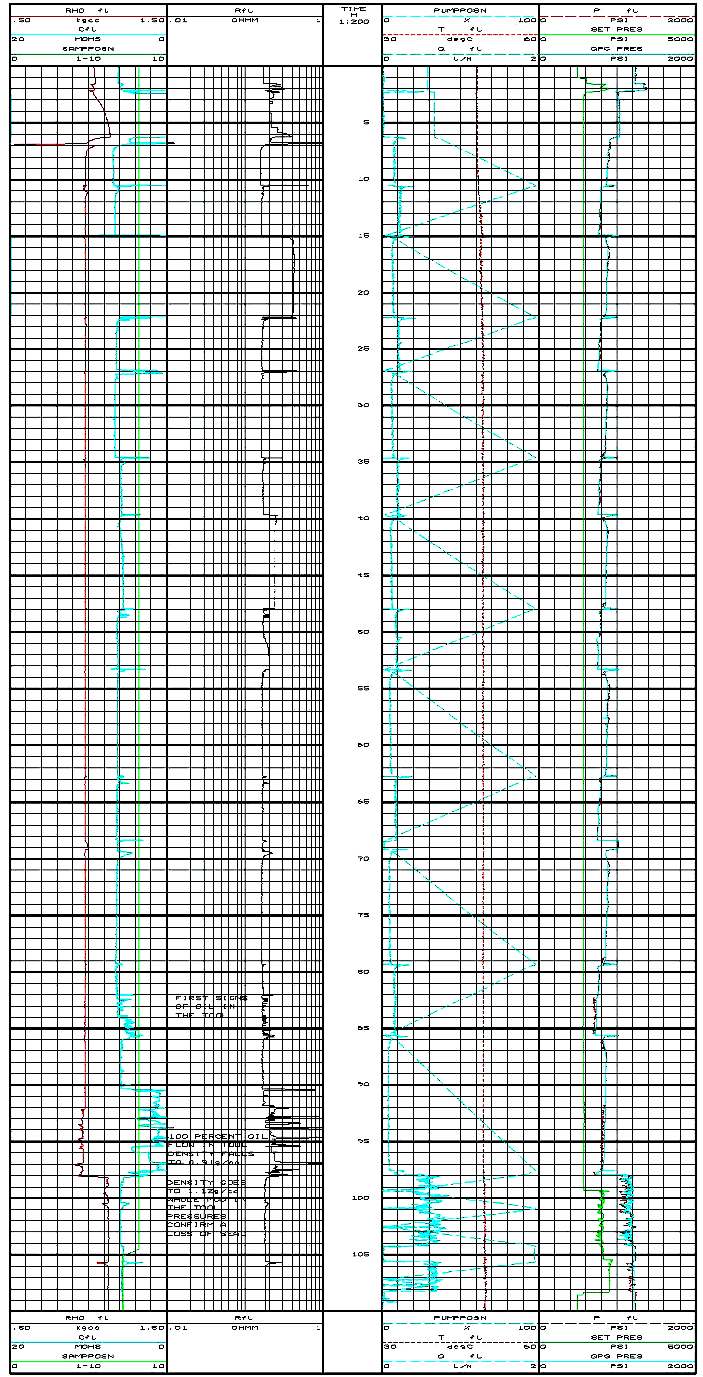
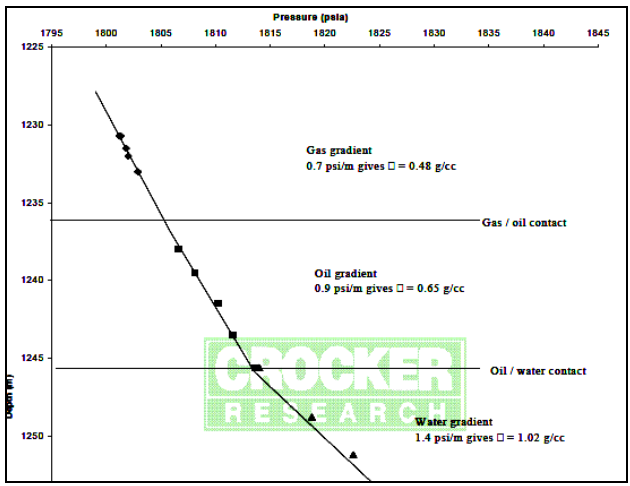
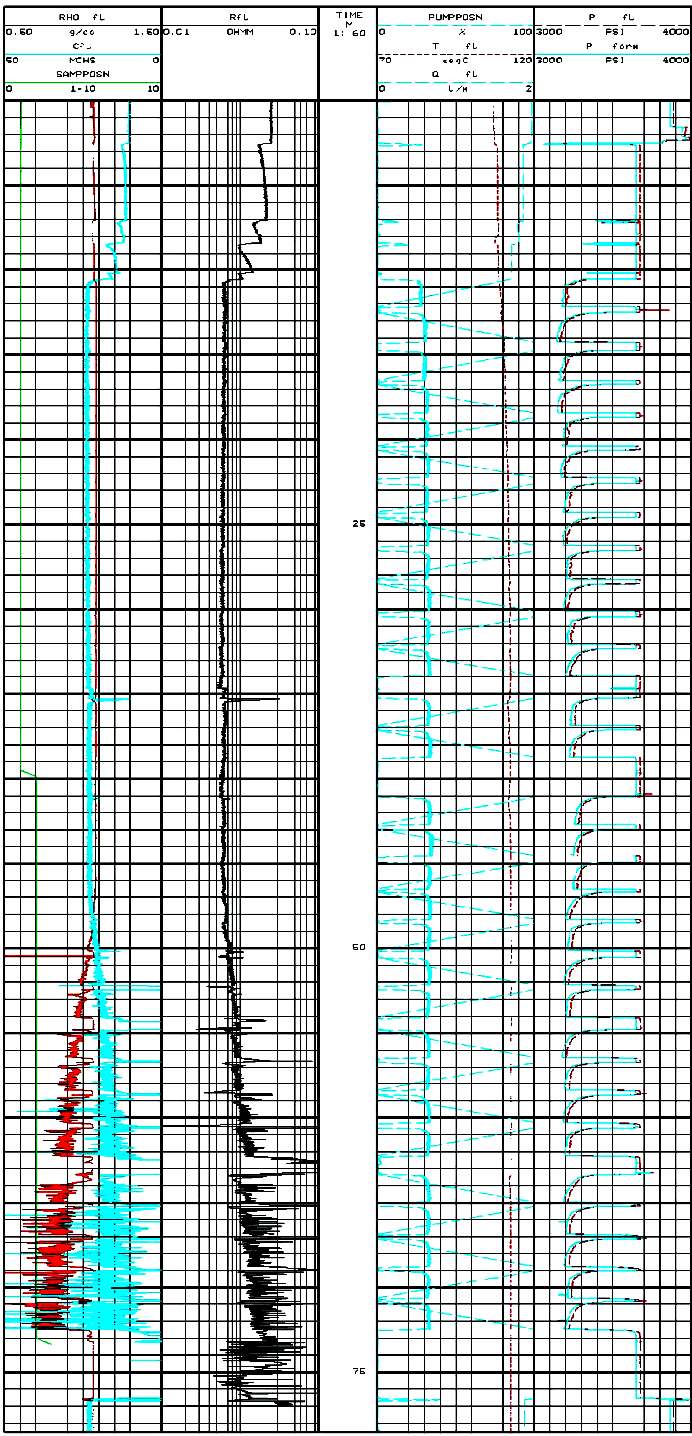
Oil density was 0.98 g/cc and contrasts strongly with the gas of Example 5. This oil is heavily biodegraded, the light ends have been removed by bacteria. Thus the oil is very under-saturated. This is curious since the gas is in contact with the oil. It seems likely that two stages of hydrocarbon migration have occurred, one of oil and a later one of gas.
|
|
||
|
Page Views ---- Since 01 Jan 2016
Copyright 2023 by Accessible Petrophysics Ltd. CPH Logo, "CPH", "CPH Gold Member", "CPH Platinum Member", "Crain's Rules", "Meta/Log", "Computer-Ready-Math", "Petro/Fusion Scripts" are Trademarks of the Author |
|||

|
||
| Site Navigation | TOOL PROFILES WIRELINE FORMATION TESTER TOOLS | Quick Links |

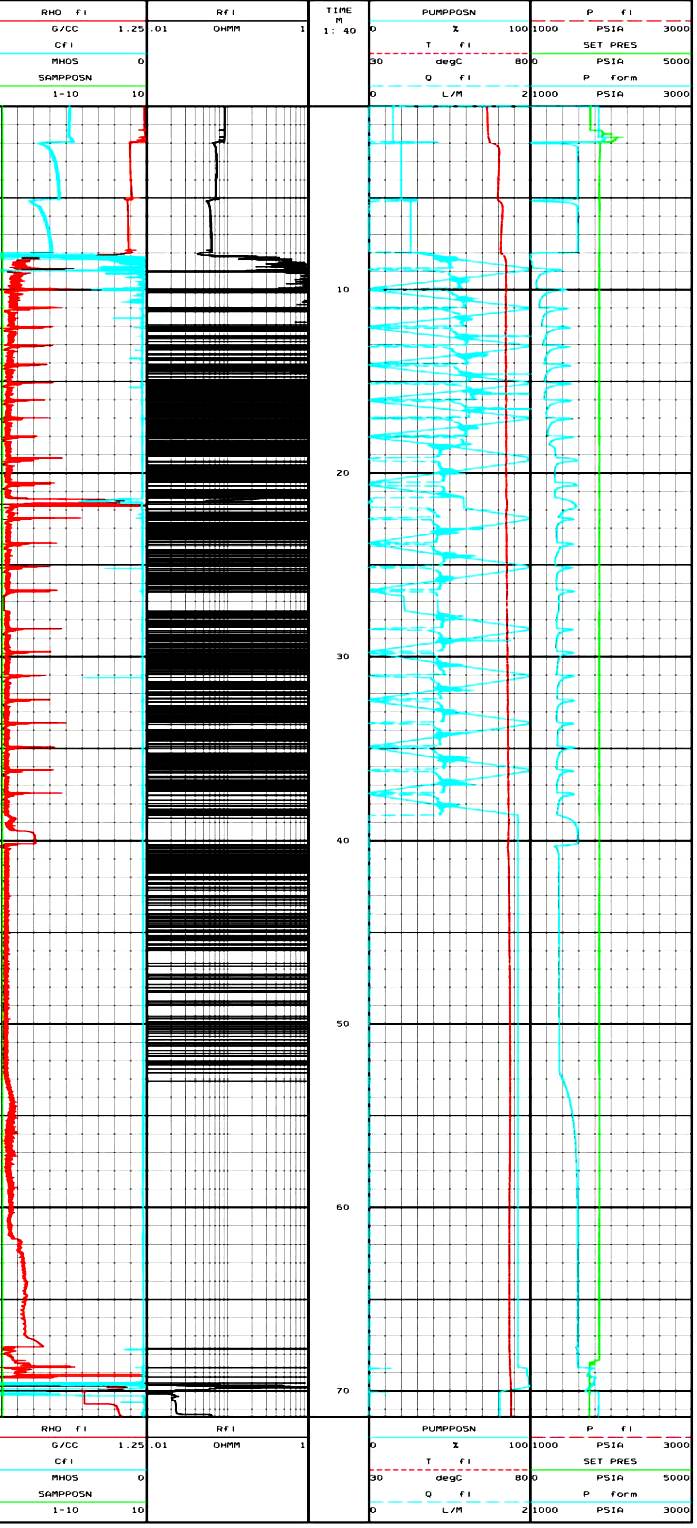
 The
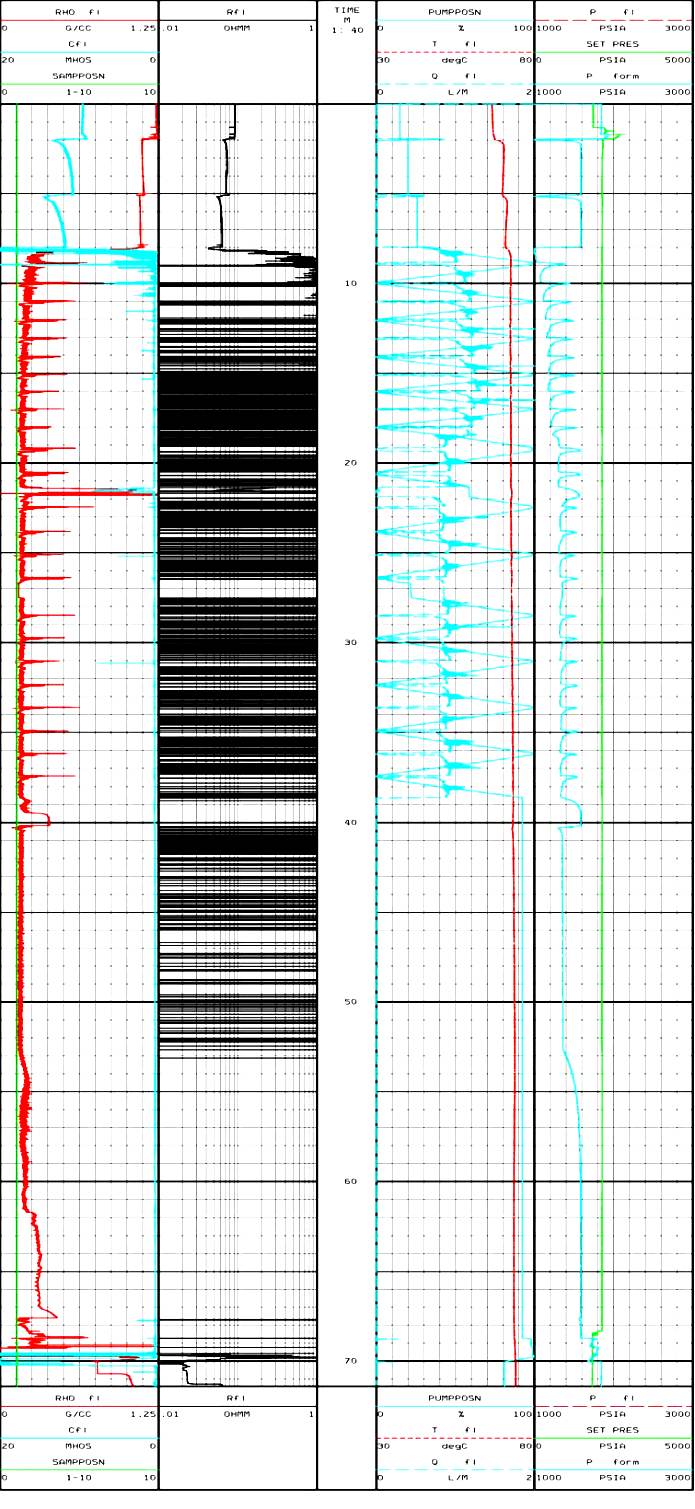
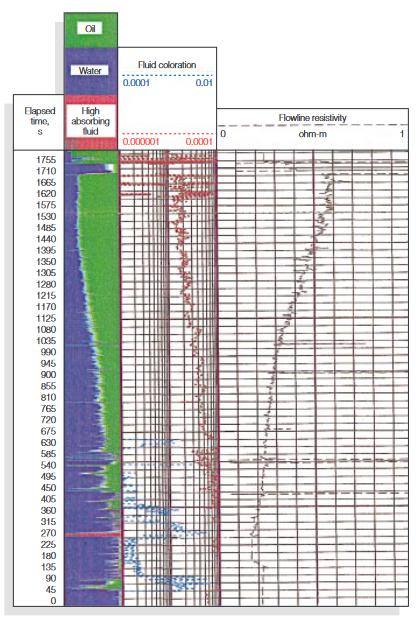
fourth possibility. Oil breakthrough occurred after about
thirty-five minutes of steady flow. Pressure drawdown was 107 psi at
a flowrate of 880 ml/min, which equates to a drawdown permeability
of 380 mD. After oil breakthrough the pressure drawdown increased to
486 psi at 720 ml/min. Assuming no relative permeability change
(which may not be valid) and a water viscosity 0.5 centipoise then
the oil viscosity is 2.75 centipoise. Please note that the oil
density is shown as 0.96 g/cc which checks well with the known
density. Four oil samples were taken.
The
fourth possibility. Oil breakthrough occurred after about
thirty-five minutes of steady flow. Pressure drawdown was 107 psi at
a flowrate of 880 ml/min, which equates to a drawdown permeability
of 380 mD. After oil breakthrough the pressure drawdown increased to
486 psi at 720 ml/min. Assuming no relative permeability change
(which may not be valid) and a water viscosity 0.5 centipoise then
the oil viscosity is 2.75 centipoise. Please note that the oil
density is shown as 0.96 g/cc which checks well with the known
density. Four oil samples were taken.