In its most usual form, an oil well log is a record displayed on a graph with the measured physical property of the rock on one axis and depth (distance from a near-surface reference) on the other axis. More than one property may be displayed on the same graph.
Well
logs are recorded in nearly all oil and gas wells and in many
mineral and geothermal exploration and development wells. Although
useful in evaluating water wells, few are run for this purpose.
It was hot and breezy in California in 1932
Thus, analysis of log and related laboratory data is required. The art and science of log analysis is mainly directed at reducing a large volume of data to more manageable results, and reducing the possible error in the assumptions and in the results based on them. When log analysis is combined with other physical measurements on the rocks, such as core analysis or petrographic data, the work is called petrophysics or petrophysical analysis. The results of the analysis are called petrophysical properties or mappable reservoir properties. The petrophysical analysis is said to be “calibrated” when the porosity, fluid saturation, and permeability results compare favourably with core analysis data. Further confirmation of petrophysical properties is obtained by production tests of the reservoir intervals. The use of well logs for evaluating mineral deposits other than oil and gas, such as coal, potash, uranium, and hard rock sequences has been practiced since the early 1930’s and is widespread today. Although the vast majority of logs are run to evaluate oil and gas wells, an increased number are being run for other purposes, including evaluation of geothermal energy and ground water. A large portion of this Handbook
A quad-combo adds a sonic log to the above tool string. This may include only compressional sonic or both compressional plus shear sonic. There may be more than one GR and caliper depending on the era of the logs.
Some
combos can have spectral GR, which adds potassium, thorium, and
uranium curves. The geology log, often called the stratigraphic log, strat log, or sample description log, is a record of the rock samples retrieved from the drilling mud, and is one of the primary sources of rock and fluid descriptions for the well. It consists of a verbal description of the rock type as well as qualitative or interpretive data concerning evidence of the fluid content of the rock. These are all useful logs and are used in any analysis of a well, if they are available. Most logs can now be recorded while drilling is going on or while tripping the drill pipe. This is called measurements while drilling (MWD) or logging while drilling (LWD). Open-hole logs require that the drill string be removed from the well bore before the logging tools can be lowered into the hole. MWD does not have this need, so measurements are available continuously as drilling proceeds. A composite log is made up of measurements and interpretations from many sources of data. It is usually made up in the office in a standard format (for the company or agency who owns the well). Since it compresses a great deal of data onto one log, it is often one of the most used items in the well file.
Most
open and cased-hole logs are recorded continuously as the tools
are pulled out of the hole. A few logs, however, may only be recorded
when the tool is stationary in the hole, such as the gravity meter
survey. Such logs are called station-by-station logs as opposed
to continuous logs. Some early station-by-station logs, by virtue
of significant improvements in measuring and recording techniques,
have become continuous logs. The first electrical log run in 1927
was station-by-station, but soon after, electrical logs were run
as continuous logs.
Logs are used for a variety of purposes depending on the nature of the data gathered. Correlation from well to well is the oldest and probably the most common use of logs. It allows the subsurface geologist to map formation depths and thicknesses and then to identify conditions that could trap hydrocarbons.
Identification of the lithology of the rock sequence is another important use of logs. A log shows many variations from top to bottom. Each wiggle has significance, but it can be related to the rocks being logged only by comparing the log with actual rock samples or a core from the well. After acquiring experience in an area it is possible for a log analyst to make an educated guess as to lithology by looking at the log. Modern analytical methods permit more accurate lithology identification, but this requires charts or mathematical solutions in addition to the curve shapes. One of the important uses of logs today is the determination of rock porosity. This measurement is significant because it tells how much storage space a rock has for fluids. No log actually measures porosity directly, but many analytical methods are available to help estimate this important property.
One of the older, but very useful, surveys is the caliper log. In open hole logging, it is used to determine hole volume and aids the engineer in designing a cementing program. It also indicates mud cake build-up and hole wash-out. Both of these indications are of interest to the log analyst when he considers the other logs. In cased hole work the caliper is often used to find casing damage and separated casing. A more recent development in logging is fracture-finding. It is important because fractures will often produce large quantities of fluid even though the rock the fractures are in would not otherwise produce commercially. Many open-hole logs have some artifacts caused by fractures, but the formation micro-scanner and borehole televiewer are the most useful.
The measurement of fluid flow in and near the wellbore is often of vital importance. Such measurements can indicate channels behind casing, casing leaks, packer leaks, tubing leaks, water influx problems, cross flow from one reservoir to another, and other production problems. Another common use for this type of measurement is the determination of water input profiles in water injection wells. A thief zone may take most of the water and leave the rest of the reservoir unflooded. Surveys of this type point out the type of remedial action that is necessary to establish a more desirable water input distribution. Generally it is not advisable to complete a well in a zone that has poor bond between cement and casing without first squeezing in more cement to seal the casing to the rock formation. A cement bond or cement evaluation log is used to identify this problem. The temperature log is commonly used to indicate the top of cement behind a newly cemented string of casing. The setting cement liberates heat and warms up the well bore, which is thus recognizable on a temperature log of the well. Another use for the temperature log is the location of points of fluid entry in a well bore or of fluid flow behind casing. As the fluid enters the well it expands and cools creating abnormally low temperature in the well at the point of entry. Acoustic noise logs also find flow entry and flow behind pipe by the noise caused by the flowing fluid. The most significant change in the use of logs, in recent years, is production monitoring. The thermal decay time log (often called a pulsed neutron log) allows for the interpretation of porosity and fluid saturation behind casing. The fluid saturation will change over time as a reservoir is depleted by production, and the changes may be monitored by logging at regular intervals, say once a year. If the production pattern is not as predicted, remedial action may be possible. The log is also used to provide porosity and fluid saturation data in wells which are not, or could not, be logged in the more conventional open-hole manner. A large suite of logging instruments is available to evaluate fluid type, fluid flow, and mechanical conditions in producing or injecting wells, in addition to those already mentioned. These are generically called production logs and are usually run in cased holes, but some are also effective in open hole or "bare-foot" completions. Production log analysis is not described in this book as excellent treatments are available elsewhere. The same logs that are used to evaluate porosity and water saturation in oil and gas wells are also used to evaluate other resources such as ground water, coal, potash, salt, uranium, oil shale, gypsum, sulfur, geothermal energy, tar sands, and hard rock minerals. Logs are also used to explore the earth's surface in general, such as in the Deep Sea Drilling Program which has helped to document the theory of plate tectonics, sea floor spreading, and continental drift.
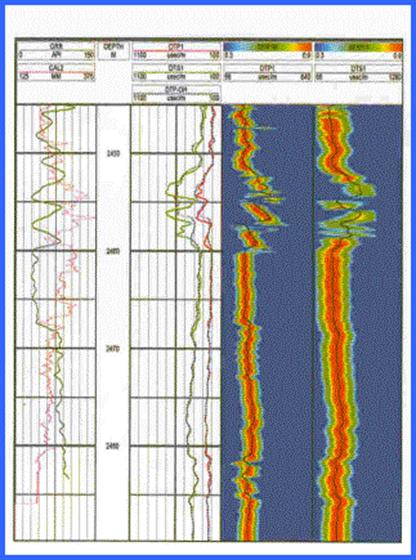
The spacing between depth grid lines is 10 feet or 5 meters for correlation scales and 2 feet or 1 meter for other scales. Heavier grid lines appear every 10 feet (5 meters) and every 50 feet (25 meters).
(Meters) Logs are presented in the field in a three track presentation. The pair of tracks 2 and 3 is often called track 4, which is used to record curves with a large range in values. Four (or more) track presentations (with all tracks to the right hand side of the depth numbers) is created in the course of computer processed log analysis. These can be generated in the computer on the logging truck or in the office. Some logs recorded prior to 1946 have only two tracks, and logs run for special purposes (eg. potash) have three tracks all to the right of the depth numbers.
The space where the depth numbers are printed is called the depth track and is often used for annotation of tops, DST and core data by the analyst. Both right and left hand margins can also be used for annotation. Note that logarithmic scales can also vary in presentation. The standard scale is 4 decades wide starting at 0.2 and going to 2000. This can be shifted one decade to give a 2 to 20000 scale or a partial decade to give 0.1 to 1000 or 0.3 to 3000. Linear scales can be ANY RANGE. So check every time to find out what scale is current on the section of log you are analyzing. Back-up scales are shown on the log heading underneath the primary scale. Back-up scales take over when the primary curve goes off-scale. Back-ups can be the same sensitivity (ie. 140 to 240 is the back-up scale to 40 to 140) or a multiple of the primary scale (ie. 0 to 500 is the back-up to a 0 to 50 scale). Usually, but not always, the multiple is 10 to 1 and the first one tenth of the back-up scale is blanked out to prevent a confusion of curve. Logs exist with back-ups with multiples of 5, 10, 100 and 1000 (all could be on the same log) which gives a considerable range of answers if the wrong scale is selected by the analyst.
The use of logarithmic scales has reduced the need for back-up scales on resistivity logs, but a back-up may also be seen to augment a logarithmic scale. It will add another four decades to the scale range. Back-ups are still common on other linear scales such as the sonic, density, neutron and gamma-ray logs. Amplified scales are often presented on resistivity or sonic logs. For resistivity logs the short normal curve can be shown amplified on a 0 to 2 or 0 to 4 scale, while the primary scale stays at 0 to 20 or 0 to 50 scale. The sonic log may show an amplified scale of 40 to 80 or 40 to 100 scale while the primary scale is 40 to 140. Amplified scales are not used on logarithmic presentations, or on metric sonic logs (scales of 100 to 300 or 100 to 500 usually give sufficient detail with back-ups).
There are many variations in the presentation of well logs. There are a few standard conventions, but local need often creates its own conventions.
Each piece of log is recorded on film and the pieces are spliced together in the order described above. A heading, with basic well data, is spliced to the top of the correlation scale film and a scale insert is spliced (usually) between each separate piece of film. These inserts show the scale of each of the recorded curves below the insert (and often above the insert as well). On computerized logging units, the inserts may be an integral part of the film.
|
|
|||||||||||||||||||||||||||||||||
|
Page Views ---- Since 01 Jan 2015
Copyright 2023 by Accessible Petrophysics Ltd. CPH Logo, "CPH", "CPH Gold Member", "CPH Platinum Member", "Crain's Rules", "Meta/Log", "Computer-Ready-Math", "Petro/Fusion Scripts" are Trademarks of the Author |
||||||||||||||||||||||||||||||||||

|
||
| Site Navigation | PETROPHYSICS COURSE WHAT IS A WELL LOG HOW ARE LOGS MADE | Quick Links |

 None
of the logs actually measure the physical properties that are
of most interest to us, such as how much oil or gas is in the
ground, or how much is being produced. Such important knowledge
can only be derived, from the measured properties listed in the
box on the left
(and others), using a number of assumptions which, if true, will
give reasonable estimates of hydrocarbon or mineral resources.
None
of the logs actually measure the physical properties that are
of most interest to us, such as how much oil or gas is in the
ground, or how much is being produced. Such important knowledge
can only be derived, from the measured properties listed in the
box on the left
(and others), using a number of assumptions which, if true, will
give reasonable estimates of hydrocarbon or mineral resources. Correlation
is usually based on the shapes of the recorded curves versus depth.
Correlation in complex geologic areas may be difficult or impossible,
and in any event requires corroboration from actual rock samples
for the initial correlations in an area. After the curve shape
patterns are recognized, they can often be used in subsequent
wells without relying too heavily on rock sample data.
Correlation
is usually based on the shapes of the recorded curves versus depth.
Correlation in complex geologic areas may be difficult or impossible,
and in any event requires corroboration from actual rock samples
for the initial correlations in an area. After the curve shape
patterns are recognized, they can often be used in subsequent
wells without relying too heavily on rock sample data. Another
of the routine uses of logs is the determination of the water,
oil, or gas saturation in the rock pores. When the porosity, oil
or gas saturation, the thickness and extent of the reservoir are
known, then it is possible to tell how much hydrocarbon is in
place in the reservoir. Again, no log actually measures the fluid
saturation directly, so analysis of indirect measurements is required.
The logs most often run for the above purposes are resistivity,
sonic travel time, density, neutron, gamma ray and spontaneous
potential logs.
Another
of the routine uses of logs is the determination of the water,
oil, or gas saturation in the rock pores. When the porosity, oil
or gas saturation, the thickness and extent of the reservoir are
known, then it is possible to tell how much hydrocarbon is in
place in the reservoir. Again, no log actually measures the fluid
saturation directly, so analysis of indirect measurements is required.
The logs most often run for the above purposes are resistivity,
sonic travel time, density, neutron, gamma ray and spontaneous
potential logs. When
it is time to perforate the casing to allow fluid to flow into
the well, there may be some doubt about how well the perforator
depths match the log depths. To overcome this uncertainty, a casing
collar gamma ray log is often run. This log is correlated to the
open-hole log. Even though the actual depths may not agree, the
zone of interest on the open hole logs is related to the collar
log depth. Then the perforating gun is positioned in relation
to the collars in the casing and perforating accuracy is assured.
When
it is time to perforate the casing to allow fluid to flow into
the well, there may be some doubt about how well the perforator
depths match the log depths. To overcome this uncertainty, a casing
collar gamma ray log is often run. This log is correlated to the
open-hole log. Even though the actual depths may not agree, the
zone of interest on the open hole logs is related to the collar
log depth. Then the perforating gun is positioned in relation
to the collars in the casing and perforating accuracy is assured.
 Usually
a log will be composed of several separate pieces spliced together
(splice can be physical, as separate pieces of film taped together,
or virtual as created by a computer playback):
Usually
a log will be composed of several separate pieces spliced together
(splice can be physical, as separate pieces of film taped together,
or virtual as created by a computer playback):