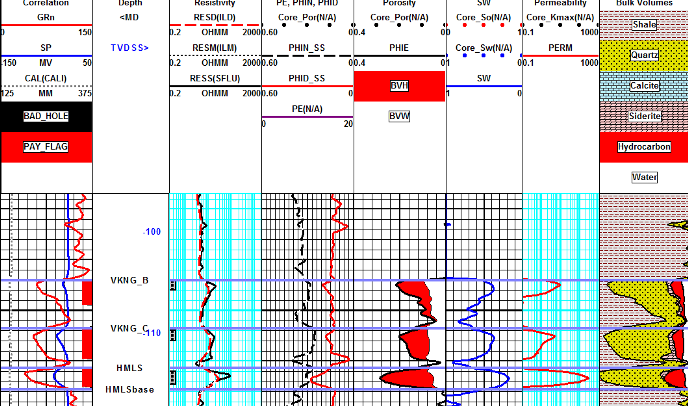
A number of useful results are derived from porosity, saturation, and permeability answers. For hand picked data, there may only be a few results from each of several zones. Each zone must be summed and averaged separately. For digitized data, many data points are summed before the average is taken over specific zones or layers. The spreadsheets called META/ESP and META/COR are available on the Downloads tab at www.spec2000.net that makes the work relatively painless. The META/ESP spreadsheet does the full log analysis as well as the sums and averages.
It is normal to apply cutoffs to each calculated result to eliminate poor quality or unproductive zones. Cutoffs are usually applied to shale volume, porosity, water saturation, and permeability. The layer is not counted as “pay” if it fails any one of the four cutoffs.
Typical cutoffs are: 1: Vsh <= VSHmax 2: PHIe >= PHImin 3: Sw <= SWmax 4: Perm >= PERMmin
Where: VSHmax = 0.25 – 0.40 PHImin = 0.03 – 0.16 SWmax = 0.30 – 0.70 PERMmin = 0.1 – 5.0 mD
The values chosen must be appropriate for the rock sequence.
Since porosity is somewhat proportional to shale volume, saturation somewhat proportional to porosity, and permeability somewhat proportional to all three, it is desirable to choose a balanced set of cutoffs. Balanced cutoffs in a hydrocarbon bearing zone usually will fail a layer with more than one cutoff. If only one cutoff fails a layer, the cutoffs may need some adjustment.
Cutoffs can be tested against production flowmeter data and can be tuned, in some cases, based on actual production rates
The basic calculations are described in the following sections:
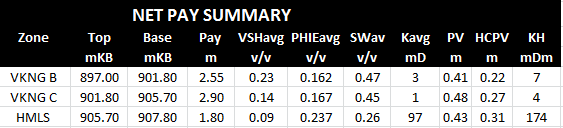
Average and cumulative rock properties are the usual result required from a log analysis. Cutoffs should be applied to each layer before summing and averaging. These data are often posted on maps and contoured to define reservoir boundaries, quality, volume, and productivity.
There are many incorrect ways to sum and average the reservoir properties. The following constitutes the ONLY correct way:
STEP 1: Calculate specific volumes by summing layers which pass shale, porosity, saturation, and permeability cutoffs: 1: PV = SUM (PHIe * THICK) 2: HPV = SUM (PHIe * (1 – Sw) * THICK) 3: KH = SUM (Perm * THICK) 4: NetPay = SUM (THICK)
STEP 2: Calculate averages: 5: PHIavg = PV / NetPay 6: SWavg = 1 – (HPV / PV) 7: Kavg = KH / NetPay 8: Khar = (1 / SUM (1 / (Perm * THICK))) / NetPay
Some computer programs print cumulative pore volume, hydrocarbon pore volume, and flow capacity over large intervals. Subtract the values at two depths to get the sum over the interval between the depths. Others print a summary page over specific intervals defined by the user. Be sure the interval matches the desired zone.
Apply cutoffs to each layer before summing. Usually Vsh, PHIe, Sw, and Perm are checked. If the data point fails any one of the cutoffs, then the layer is not counted as pay. A Phi*Sw cutoff is also useful to detect zones that will make water as well as hydrocarbon.
These procedures can be applied to log or core data.
Cumulative volume results are in feet or meters per unit area and flow capacity is in md - feet or md - meters.
Net pay is seldom a good indicator of the quality of a zone unless porosity and water saturation are constant throughout the zone in all wells.
Both hydrocarbon pore volume and flow capacity should be mapped to determine zone quality.
Recoverable reserves and, in some jurisdictions, maximum permissible flow rate are determined by hydrocarbon pore volume.
The economics and risk assessment of a well depend almost entirely on flow capacity.
Estimating productivity is a useful way to compare the quality of wells from similar reservoirs, even when results are not calibrated.
1: Qo = KV1 * Kh * (PF – PS) / VISO 2: Qg = KV2 * Kh * ((PF – PS) ^ 2) / (FT + KT2)
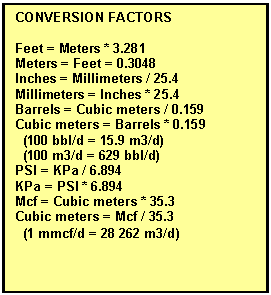
Where: KV1 = 0.0001 for English units (bbl/day) KV1 = 0.000 007 560 for Metric units (m3/d) KV2 = 0.0001 for English units (mcf/day) KV2 = 0.000 010 920 for Metric units (m3/d) KT2 = 460 'F for English units KT2 = 273 'C for Metric units
Results are in bbl/day or m3/day for oil and mcf/d or e3m3/day for gas. The estimated flow rate (Qo or Qg) is called the initial deliverability, Qd. Wells are often rate limited by law or facilities to an initial rate, Qi, which is less than deliverability, Qd.
Use only if zone is not fractured. Use KH from DST if zone is fractured.
Calibrate KH from logs with core and/or un-stimulated DST, perf test, or initial production.
These formulas should be used as guides to well quality only. However, by calibrating permeability to core and production data, a reasonable match can be made.
Even if results cannot be calibrated, due to lack
of data, the productivity gives a good method for comparing the
relative quality of two zones. |
|
|||||
|
Page Views ---- Since 01 Jan 2015
Copyright 2023 by Accessible Petrophysics Ltd. CPH Logo, "CPH", "CPH Gold Member", "CPH Platinum Member", "Crain's Rules", "Meta/Log", "Computer-Ready-Math", "Petro/Fusion Scripts" are Trademarks of the Author |
||||||

|
||
| Site Navigation | PETROPHYSICS COURSE HOW TO CALCULATE PAY RESERVES PRODUCTIVITY | Quick Links |

 STEP
1: Productivity index
STEP
1: Productivity index