The
direct aims of the static reservoir description are:
The direct aims of the dynamic reservoir description are: A large fraction of the data for the static model comes from the petrophysical analysis, along with the core and petrographic data used to calibrate the log analysis.
Reservoir Description means many things to many people. Thousands of consultants, contractors, and oil company department heads use the term with subtle or serious differences in meaning.
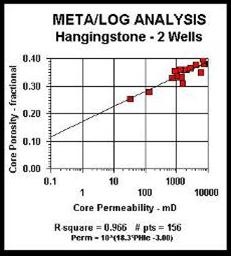
Core analysts think reservoir description is the measurement of porosity, permeability, grain density, capillary pressure, relative permeability, and electrical properties of the rocks, as well as facies description from observation of the depositional environment seen in slabbed core and core photographs. This work is at the centimeter level.
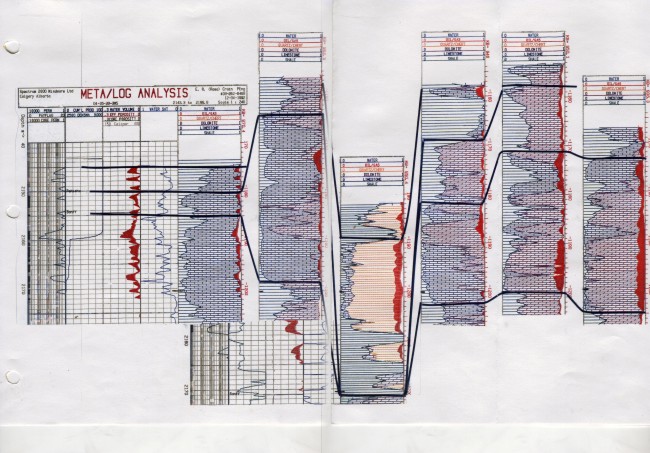
Geologists perceive reservoir description as the interpretation and mapping of petrographic results, core analysis, petrophysical rock properties, and seismic attributes into stratigraphic sequences and/or flow units. In the simplest cases, the mapping is based solely on correlation of raw log curves. In more elaborate studies, all of the measured and computed data will be mapped. Dipmeter and pressure transient analysis results may be introduced to assist in correlation or definition of reservoir boundaries or fault planes. These maps are also at the multi-meter level vertically and either the seismic shot point spacing or well spacing areally. The geological model obtained is the static reservoir description which, of course, can be monitored and varied over time by acquisition of new petrology, core data, or petrophysical rock properties from new wells or logs run through casing. Time-lapse (4-D) seismic or through casing logs may also be used to monitor hydrocarbon contact changes.
Simulation engineers visualize reservoir description as a totally dynamic description of reservoir performance. They do use the static reservoir description (the geological model) as the basic foundation for the reservoir simulation. The bricks and mortar added to this foundation are the pressure and production data, and fluid properties, from the reservoir engineer. The object of the simulation is first to match production history, then to predict future behaviour of the reservoir. A good history match usually means that the geological model is reasonably accurate. The critical test is to compare the performance prediction with actual performance after a few years has elapsed. The reservoir simulation grid is usually a few to many meters vertically and many meters areally. Since more than one geological model could provide an adequate history match, calibration can only come with the passage of time and the arrival of new well data. Various production scenarios may be run in order to optimize reservoir recovery and economics.
Production and facilities engineers see the dynamic reservoir model as a template for design and economic evaluation of production, gathering, treating, and pipeline equipment required to handle the predicted reservoir performance. The timing of compressor installations, water disposal wells, and conversion of wells to injection are paramount considerations. Both undersized and oversized facilities reduce the economic return from hydrocarbon production. Drilling and production engineers use the various scenarios to plan in-fill drilling and re-completion operations on the wells in the reservoir. Economic engineers use the dynamic and static models to predict cash flow, financing requirements, and investment decisions. Management and shareholders use the models to assist in making decisions as well. The truth is that all these definitions are true, but the sum of the parts is even more true. Multi-disciplines generate the most complete reservoir description. Teamwork is everthing! Few people are talented enough to do it all without help from other specialists. “Integrated” reservoir models are based on the multi-discipline approach to the model. Integrated reservoir description combines geology, geophysics, petrophysics, reservoir engineering, production engineering, and numerical simulation. All of the disciplines listed above talk to each other and iterate their interpretations until all the data fits a common definition of the reservoir. For example, a history match may fail because there is not enough reservoir volume to account for production and pressure trends to date. Reservoir volume can be increased by changing the parameters and cutoffs that go into petrophysical calculations, or the geological mapping can be more generous in contouring the data. One of the biggest problems is up-scaling from the sub-millimeter pore distribution through all the steps to the multi-meter grid cells of a reservoir simulation model. An open mind and a willing heart might be needed to overcome a lot of problems!
A flow unit is a rock body with a distinct pore system or
porosity-permeability distribution. Each flow unit responds
differently to fluid flow and production. Defining flow units in
sandstone reservoirs is relatively straight forward using shale
volume, porosity, water saturation, and permeability calculated from
a petrophysical log analysis. Calibration to core data will help
make the results believable.
|
|
||
|
Page Views ---- Since 01 Jan 2015
Copyright 2023 by Accessible Petrophysics Ltd. CPH Logo, "CPH", "CPH Gold Member", "CPH Platinum Member", "Crain's Rules", "Meta/Log", "Computer-Ready-Math", "Petro/Fusion Scripts" are Trademarks of the Author |
|||

|
||
| Site Navigation | PETROPHYSICS COURSE WHAT IS RESERVOIR DESCRIPTION | Quick Links |


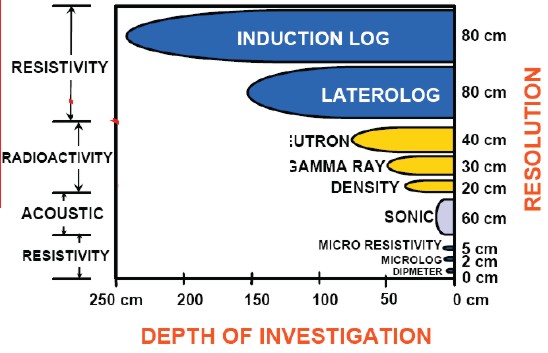 Petrophysicists see reservoir description as the evaluation of well
logs to obtain reservoir rock and fluid properties, such as shale
volume, porosity, water saturation, permeability, and lithology on a
foot by foot basis, as well as sums and averages over specific
reservoir units. This work is usually calibrated by core analysis
and petrographic data where it is available. When well log data is
combined with other geoscience data to form a coherent picture, it
is called Integrated Petrophysics. Some work, such as analysis of
formation microscanner images, may be at the centimeter level, but
most is done at the tool resolution level – usually 0.3 to 1 meter.
Petrophysicists see reservoir description as the evaluation of well
logs to obtain reservoir rock and fluid properties, such as shale
volume, porosity, water saturation, permeability, and lithology on a
foot by foot basis, as well as sums and averages over specific
reservoir units. This work is usually calibrated by core analysis
and petrographic data where it is available. When well log data is
combined with other geoscience data to form a coherent picture, it
is called Integrated Petrophysics. Some work, such as analysis of
formation microscanner images, may be at the centimeter level, but
most is done at the tool resolution level – usually 0.3 to 1 meter.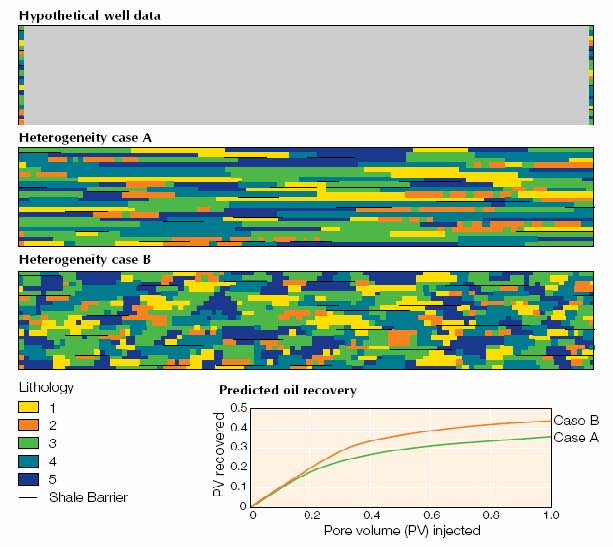
 Reservoir engineers view reservoir description as the analysis and interpretation
of pressure transient data from drill stem tests or
production tests. Flow capacity (permeability times thickness) and
distance to reservoir boundaries (if they are close enough to be
sensed by the pressure response) are the usual results obtained. In
addition, pressure changes with production versus time provide grist
for the material balance calculation mill. Production history (oil,
gas, and water volumes versus time) coupled with decline curve
analysis leads to predictions of ultimate hydrocarbon recovery. This
work is also at the multi-meter level vertically and limited to the
tested or produced wells only. Reservoir engineers are concerned
with this dynamic reservoir description, as well as the static
description for calculating reservoir volume and recoverable
reserves.
Reservoir engineers view reservoir description as the analysis and interpretation
of pressure transient data from drill stem tests or
production tests. Flow capacity (permeability times thickness) and
distance to reservoir boundaries (if they are close enough to be
sensed by the pressure response) are the usual results obtained. In
addition, pressure changes with production versus time provide grist
for the material balance calculation mill. Production history (oil,
gas, and water volumes versus time) coupled with decline curve
analysis leads to predictions of ultimate hydrocarbon recovery. This
work is also at the multi-meter level vertically and limited to the
tested or produced wells only. Reservoir engineers are concerned
with this dynamic reservoir description, as well as the static
description for calculating reservoir volume and recoverable
reserves.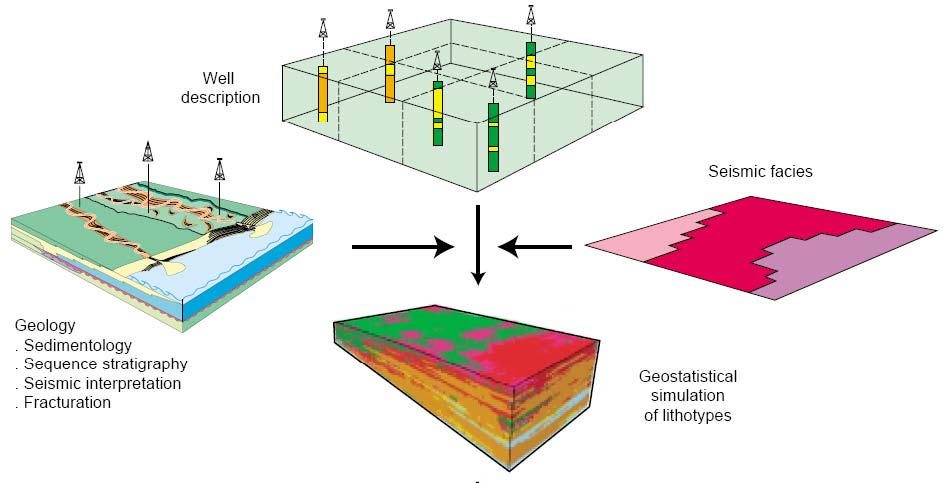
 Flow units are the basic breakdown of a
reservoir rock into layers. Each layer, or flow unit, can be
treated as a homogenous rock with uniform properties. A series of
layers make up a zone, and a series of zones make up a reservoir.
Flow units are the basic breakdown of a
reservoir rock into layers. Each layer, or flow unit, can be
treated as a homogenous rock with uniform properties. A series of
layers make up a zone, and a series of zones make up a reservoir.