Petrophysical Training
Licenses
|
 HOW TO GET STARTED
The 20 or so articles in this Chapter comprise a “Reader’s
Digest” version of Crain's Petrophysical Handbook, specially
designed for Newbies to the Science of Petrophysics in the
petroleum and mining industries. Because many professional
and technical people grow-up in diverse career paths,
Newbies could be anyone: a CEO, CFO, geoscientist, engineer,
geotech, student or instructor looking to understand what
petrophysics can do for their company or career.
Petrophysics, literally the Physics of Rocks, is the
foundation of geology, geophysics, and petroleum / mining
engineering. We all rely on the Shared Earth Model, which is
described by the integration of petrophysics with all these
other disciplines. In fact, any resource exploration or
development project that ignores petrophysics is destined to
be inefficient, or worse, doomed to failure.
If you might be displaced by the
energy transition, or are looking for a long-term career
path, or a university specialty that could lead to an
interesting and rewarding life, petrophysics in its broadest
sense may suit you.
Let's start with the basics of oil and gas and later we'll
do the same for the mining industry.
SOME PETROLEUM BASICS
Petrophysics is mainly used in petroleum exploitation, but also
in defining mining and ground water resources.
To understand petrophysics, you need to understand rocks and the
fluids they contain, how the earth's surface and subsurface
change shape, and how pressure, temperature, and chemical
reactions change rocks and fluids over eons of time. That's a
tall order.
 Rocks
are formed in several ways, but usually end up as moderately flat
layers, at least initially (mountain building comes later). As
successive layers are laid on top of each other, the Earth
builds a sequence of rocks with varying physical properties.
Some layers will have open spaces, called pores or porosity,
that contain fluids (water, oil, or gas). A rock on Earth with
porosity cannot be "empty" -- they must contain something, even
if it is only air. Rocks
are formed in several ways, but usually end up as moderately flat
layers, at least initially (mountain building comes later). As
successive layers are laid on top of each other, the Earth
builds a sequence of rocks with varying physical properties.
Some layers will have open spaces, called pores or porosity,
that contain fluids (water, oil, or gas). A rock on Earth with
porosity cannot be "empty" -- they must contain something, even
if it is only air.
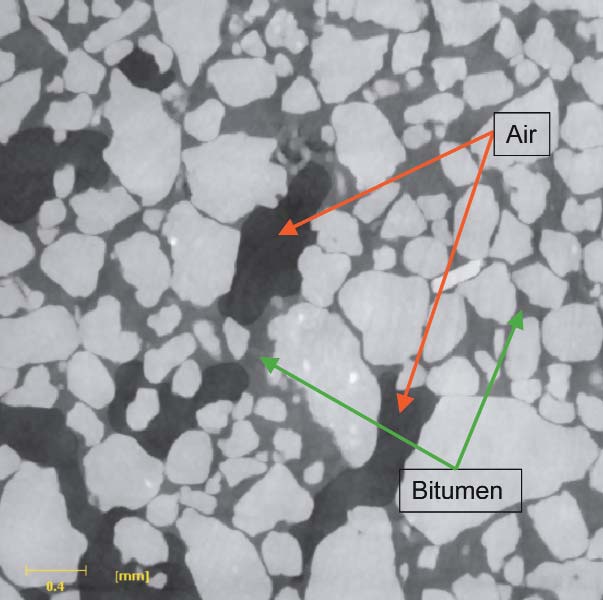
 Microphotograph of a rock -- dark blue colour is the porosity
where Microphotograph of a rock -- dark blue colour is the porosity
where
oil, gas, and water can be held inside the rock.
Think of a porous rock as similar to a
huge sponge full of holes that can soak up fluids. Although we
often talk about "oil pools", these are not tanks of oil
underground -- they are porous rocks. The porosity, or quantity
of open space relative to the total rock volume, can range from
near zero to as much as 40%. Obviously, higher values of this
physical property of a rock are good news.
 Some
rocks have very little porosity and do not hold much in the way
of fluids. These are often called "tight" rocks. Both tight and
porous rocks can contain animal and plant residue that are
ultimately transformed into hydrocarbons such as coal, oil, or
natural gas that we can extract and use to power vehicles and
heat our homes. As the plant and animal residues mature into oil
or gas, they may migrate through porosity or natural fractures
in the rock until trapped by a non-porous rock structure.
Sometimes a rock only sources itself or an adjacent porous rock,
so little migration occurs. Some
rocks have very little porosity and do not hold much in the way
of fluids. These are often called "tight" rocks. Both tight and
porous rocks can contain animal and plant residue that are
ultimately transformed into hydrocarbons such as coal, oil, or
natural gas that we can extract and use to power vehicles and
heat our homes. As the plant and animal residues mature into oil
or gas, they may migrate through porosity or natural fractures
in the rock until trapped by a non-porous rock structure.
Sometimes a rock only sources itself or an adjacent porous rock,
so little migration occurs.
An anticline, the simplest form of petroleum trap 
Rocks that are capable of holding hydrocarbons in economic
quantities are called reservoir rocks. Rocks in which the plant
and animal residue has not been fully converted to useful
hydrocarbons are called source rocks. Some rocks are both source
and reservoir; others are barren of hydrocarbons, and some
others may act as the trapping mechanism that keeps hydrocarbons
from migrating to the surface and escaping.
A trap is what keeps oil and gas in the rocks until we drill
wells to extract the hydrocarbons. Coal, being a solid, doesn't
need a trap to be kept in place.
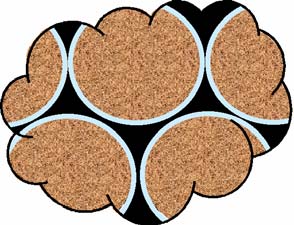  Reservoirs
that contain oil or gas also contain water. The quantity of
water relative to the porosity is called the water saturation.
In the illustrations, the brown colour is solid rock grains and
the space around the grains is the porosity. The black colour is
the hydrocarbon and the white is the water, which forms a thin
film coating the surfaces of each rock grain. This is a
water-wet reservoir (left). In an oil-wet reservoir, the black
and white colours are reversed (right). Reservoirs
that contain oil or gas also contain water. The quantity of
water relative to the porosity is called the water saturation.
In the illustrations, the brown colour is solid rock grains and
the space around the grains is the porosity. The black colour is
the hydrocarbon and the white is the water, which forms a thin
film coating the surfaces of each rock grain. This is a
water-wet reservoir (left). In an oil-wet reservoir, the black
and white colours are reversed (right).
Finding and evaluating the economics of such reservoirs is the
job of teams of geoscientists and engineers in petroleum and
mining companies. A petrophysicist, or someone playing this
role, will be part of that team.
Once a useful accumulation has been found, drilling, completion,
and production engineers take over to put wells on stream. Oil
production may initially flow to surface due to the pressure in
the reservoir. Some oil pools do not have enough pressure to do
this and need to be pumped. Depending on the reservoir drive
mechanism, some wells that start flowing will later need to be
pumped. Water may be produced with the oil. It is separated and
disposed of by re-injection into a nearby unproductive reservoir
layer. You can't just dump the water in the nearest swamp.

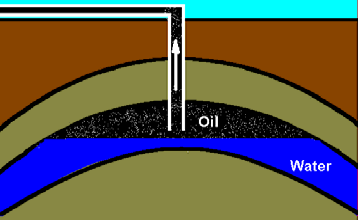
Aquifer Drive -- Before ... and After some production
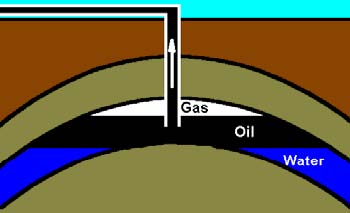
Gas Cap Drive
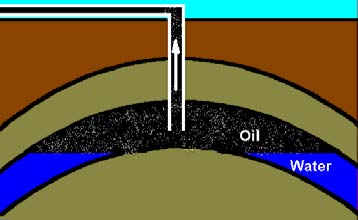
Gas Expansion Drive
An aquifer drive mechanism usually maintains the reservoir
pressure for some time but may drop off gradually. Recovery factors vary from 30 to 80% of the oil in place. The oil water
contact rises as production depletes the oil. A gas cap drive
pushes oil out as the gas expands. Recovery factor is similar to
aquifer drive. There may or may not be some aquifer support.
The gas oil contact drops as the oil is depleted. Gas expansion
reservoirs do not have aquifer or gas cap support. Gas dissolved
in the oil expels oil into the well bore because the pressure at
the well bore is below the reservoir pressure. Recovery factor is
awful - usually less than 10%, but this can be improved to maybe
20% by injecting water nearby to increase or maintain the
reservoir pressure. Water floods, carbon dioxide injection, and
re-injection of produced gas or water can be used in nearly any
reservoir to improve recovery efficiency.
Gas wells do not need pumps, but if they also produce water, a
special process called artificial lift is used to get the water
out. That water is also disposed of legally.
 The
economics of a reservoir varies with improving technology.
Bypassed reservoirs, discovered and ignored years ago, are now
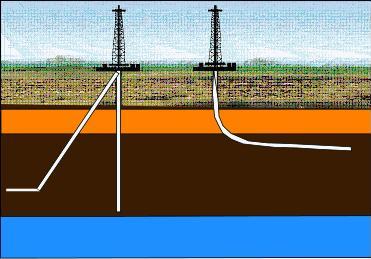
economic due to technical improvements in drilling practices and
reservoir stimulation techniques. Horizontal wells and deep
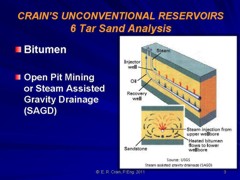
water drilling are now common. The use of heat or steam to assist
production of heavy oil or bitumen, and multi-stage hydraulic fracturing to
stimulate production in tighter reservoirs are relatively new
techniques and relatively economic today. Obviously the specific
price of oil or gas after delivery to the customer plays an
important role in how much effort can be expended to recover oil
and gas from underground. The
economics of a reservoir varies with improving technology.
Bypassed reservoirs, discovered and ignored years ago, are now
economic due to technical improvements in drilling practices and
reservoir stimulation techniques. Horizontal wells and deep
water drilling are now common. The use of heat or steam to assist
production of heavy oil or bitumen, and multi-stage hydraulic fracturing to
stimulate production in tighter reservoirs are relatively new
techniques and relatively economic today. Obviously the specific
price of oil or gas after delivery to the customer plays an
important role in how much effort can be expended to recover oil
and gas from underground.
The next section describes how the oil and gas industry will
handle the energy transition. Things will change, but the oil
and gas industry aren't going anywhere anytime soon. In 2023,
the Indian government ordered 500 new jumbo jetliners with a
lifespan of about 50 years. Somebody somewhere has to
supply the fuel.
FUTURE OF OIL AND GAS
Climate change is REAL and our use of oil and gas as a fuel needs to
change now to reduce CO2 emissions. Government
agencies have set aspirational goals to reduce emissions by some
arbitrary amount by some equally arbitrary date. But there is no
detailed roadmap to achieve the goals. How many electric
furnaces are needed to replace oil and gas home heating? Ditto
automobiles, delivery and transport trucks, tractors and
harvesters, ocean liners, container ships, ferries. Ditto trains, planes??? Ditto oil, gas, and coal fired power plants. Plus the
old infrastructure has to be maintained while the new is put into
place.
The quantities and costs are colossal for a world approaching 8
billion people.
However, oil and gas
will never disappear. Even if we electrify everything
possible, it still needs lubrication, paint, and insulated
wires. Solar panels are 50% plastic, so is your food packaging.
Except for cotton and wool, all your clothes are made from
petrochemicals. Most of your house is too: carpets, cupboards,
counter tops, siding, roofing, flooring, glue-lam beams, window frames, doors,
tubs and shower surrounds.... Don't forget computers, internet
servers, smartphones...tires for all those electric cars and trucks, and asphalt
pavement to run them on.
There are no economic alternatives unless you like living in
caves, so use of plastics and the oil and gas needed to make them have a long
life expectancy. We do need to stop burning them as fuels- there
are alternatives for that!!
So we just need to get smarter about extracting, refining, an
using oil and gas. Are you up to the challenge?
petrophysiCS and the Mining industry
For this article, we are expanding the definition of
petrophysics to include the exploration methods performed on
or near the surface to locate potential ore bodies, using
all the physical principles we remember from our oil field
well logging experience. Another article covering borehole
logging in the mining environment is located
HERE.
But first, a little background to set the stage. A 2023
International Energy Agency (IEA), stated that “to reach
net-zero emissions by 2050, we need to be producing SIX
times the current global output of minerals just to build
the turbines, transmission lines, batteries, and other items
essential for low-carbon energy infrastructure. Instead, we
are mining less than we did in 2019. A 2020 Pan-Canadian
Geoscience Strategy report suggested that “a strategy was
needed to develop next generation geoscience knowledge and
tools to efficiently target higher-grade or deeper deposits,
with the ultimate goal being a mine of the future that
produces zero waste”.
Zero waste may be a bit of a stretch. Regardless, new mines
are urgently needed and we already have the tools, and the
petrophysicists and other geoscientists to use them. There
are a surprising number of tools and analysis techniques
available. No single one is a “magic-bullet, although some
combinations may come close.
The first Secret to Success is to choose the appropriate
tools and integrate the results to gain the best possible
understanding of the potential ore body. The second is to
combine the talents of both mining and
petroleum geoscientists to encourage collaborative and
innovative solutions to the search for critical minerals.
The “Petro” in Petrophysics means
“rock”, not “petroleum”! The right kind of rock is what
mining engineers, management, and shareholders are looking
for. It is time to integrate all our petrophysical /
geoscience skills to find those deeper prospects we know
must be out there. Our World depends on our success.
SOME
MINING BASICS
Many metals are found in the form of massive sulphide ore
bodies on or below the surface of the Earth. A massive
sulphide deposit is defined as an accumulation of sulphide
minerals which are normally composed of at least 40% to 100%
sulphide minerals, bounded on all sides by rock with little
or no sulphide minerals. Many deposits have a substantial
component of vein-like sulphide mineralization, called the
stringer zone, mainly in the footwall strata. A typical ore
body is 1 to 5 million tonnes of rock. Massive sulphides can
be hosted in volcanic or sedimentary rocks.
The main sulphide minerals are:
iron pyrite FeS2 (fool's gold),
pyrrhotite Fe(1-x)S (x=0 to 0.2),
troilite (magnetic pyrite) (Zn,Fe)S,
galena (PbS), and
chalcopyrite (Cu,Fe)S2.
Many mines produce more than one base metal and often one or
more precious metal, like silver and gold. Some more exotic
minerals can be found in the tailings of older mines.
A sulphide ore body may be found with multiple layers or
lenses, and are denser and more conductive than the
surrounding rock. These properties lead to numerous surface
and borehole geophysical techniques that can be used to
locate, and to some degree, quantify sulphide deposits. Core
assay data is the main measure of ore grade, and grade
thickness maps are the usual method of visualization; 3-D
display software is also common.
Many existing mines are shallow, and as these are depleted,
deeper exploration is now required. Some older mines can be
expanded to previously unknown deeper zones using modern
exploration methods. The Kidd Creek mine in Timmins, Ontario
is the largest massive sulphide deposit in the World, and
also the deepest at 2900+ m. produces zinc, copper, and
silver.
Gangue (pronounced “ɡæŋ” or “gang”) is the commercially
worthless material that surrounds, or is closely mixed with,
a wanted mineral in an ore deposit. It is distinct from
overburden (waste rock or soil) displaced during mining,
without being processed, and from tailings, which is rock
already stripped of valuable minerals by some form of ore
processing technique.
The separation of valuable minerals from gangue minerals is
known as mineral processing, mineral dressing, or ore
dressing. It is a necessary, and often significant, aspect
of mining. It can be a complicated process, depending on the
nature of the minerals involved.
borehole logging IN the Mining ENVIRONMENT
For
clarity, we will refer to logs run for the mining industry as
“borehole logs” and those for the oil and gas industry as “oilfield
logs” or “well logs”, even though the guiding physical principles
are the same for both.
It is difficult to make direct comparisons between oilfield logging
tools and borehole tools. Many contractors developed their own
tools and probes are often customized to suit a particular
exploration challenge. The result is less standardization. Some
contractors offer a complete range of services from data acquisition
to mapping, while others specialize in smaller projects, by
supplying tool rentals. Happily, many of the borehole log names are
well-known to the oilfield log analyst, as the measurement
principles are the same. Acoustic, gamma ray, spectral gamma ray,
density, neutron and electrical logs are common to both industries.
In general, borehole tools are smaller and have reduced temperature
and pressure ratings (eg., 20 mPa and 80 degC) compared to oilfield
tools (100 mPa and 150 degC). However, many standard oilfield tools
are available in slim-hole versions and are quite suitable for
mineral borehole logging. A typical slim-hole gamma ray tool is just
42.9 mm (1-13/16 in) in diameter and approximately a meter long,
compared to a mineral service contractor’s GR tool at 38 mm diameter
and length of 0.63 meters.
There is a striking difference in scale between borehole logging
operations for mining, and that for petroleum. Mining drill-rigs
are typically portable (even heli-portable), and boreholes are
drilled to recover core or, in the case of reverse circulation (RC)
drilling, to recover samples. Boreholes can be blasted or drilled,
with logging equipment typically consisting of 3 components: a data
acquisition system to collect data from the downhole probe, a winch
to deploy the probe into the borehole, and the downhole probe
itself, which might be standalone or stackable.
borehole logging and coring Programs
The primary
logging measurements would be one or more of the following:
electrical conductivity (or resistivity), magnetic susceptibility,
natural gamma radiation (total and spectral), acoustic velocity (or
travel time), bulk density, and more recently, induced gamma ray
spectroscopy to identify particular metallic elements in the host
rock.
Specialty logs such as magnetic susceptibility, induced
polarization, or high resolution temperature logs may be used as
well.
Terraplus in Canada, offers auxiliary equipment such as video
inspection systems, borehole geophones, and hydrophone arrays, plus
ground penetrating radar antennas for single hole investigation and
cross-hole tomography. In the USA, Century Geophysical, among
others, provides a wide variety of tools for the mining industry.
The service providers are usually local contractors or the mining
company itself.
Geological Survey of
Canada and the US Geological Survey have
also developed their own logging tools, mostly used in mineral
reconnaissance surveys.
The mining
industry relies heavily on coring, core description, and lab work
for its geotechnical and geomechanical logs. Very detailed
lithology, stratigraphy, and structure are annotated on these logs,
as well as detailed notes on grain size, texture, and rock fabric.
This information is entered into 3-D modeling software. Rock
strength, discontinuities, faults, and fractures are carefully
mapped into the model. Borehole logs and core photos are added to
complete the 3-D display.
The model is constantly updated throughout the feasibility, design,
development, operational, and expansion phases of a mines long
lifetime. The integrity of the mine and the safety of the workers
depend on the accuracy of this model. No shortcuts allowed!
The coring and logging procedures described above are also used to
study geomechanical properties for dams, tunnels, highways,
foundations, and many other large construction projects.
 BASIC PETROPHYSICS BASIC PETROPHYSICS
"Last week, I couldn't spell Petrophysicist. Now I are one."
That describes me in 1962 as I moved from Montreal to Red Deer,
Alberta to run well logs for a company called Schlumberger. The
word petrophysics had been coined 12 years earlier by a
geologist named Gus Archie and it wasn't used much back in the
day. Lately it has attained a certain cachet, denoting a professional
level career path.
What is a "well log" you ask. It is a record of measurements of
physical properties of rocks taken in a well bore, usually
drilled for oil or gas, but possibly for ground water or
minerals. Think of a ship's log. The first record of such a log
dates back to 1846 when Lord Kelvin measured temperature
versus depth in water wells in England, from which he deduced
that the Earth was 7000 years old. The fact that he was wrong is
not important. Log analysis is an imperfect science.
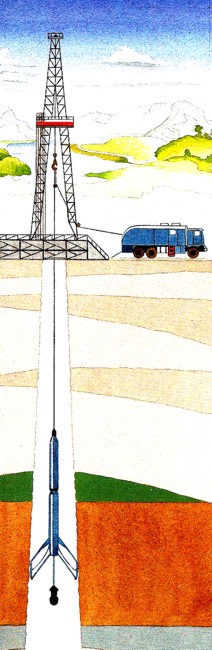
Illustration of a wireline logging job: logging truck with
computer cabin, cable and winch (right), cable strung from
winch into drilling rig derrick and lowered into bore hole, with
logging tool at the end of the cable. Logs are recording while
pulling the tool up the hole. Logs can also be run with special
tools located at the bottom of the drilling string, or
conventional tools can be conveyed on coiled tubing or drill
pipe
The first logs for oil field investigation were run by the
Schlumberger brothers, Marcel and Conrad, in 1928 in
Pechebron, France. Soon, the service migrated to North and South
America, Russia, and other locations in Asia. At that time, the
only measurement that could be made was of the electrical
resistivity of the rocks. High resistivity meant porous rock
with oil or gas, or porous rock with fresh water, or tight rock
with very low porosity. Low resistivity meant porous rock with
salty water or shale. Take your pick. Local knowledge helped.
One virtue of the well log was that the top
and bottom of each rock layer could be defined quite accurately.
When the log and depths were compared to the rock sample chips
created by the drilling process, a reasonable geological
interpretation might be possible, but was far from infallible.
By 1932, the spontaneous potential (SP) measurement was added.
The analysis rules expanded: low SP meant shale, or tight rock,
or fresh water. High values meant salt water with or without
oil or gas in a porous rock. The resistivity could then be used
to decide on water versus hydrocarbons. Perfect. Except there
were lots of shades of grey and the SP was not always capable of
defining anything.
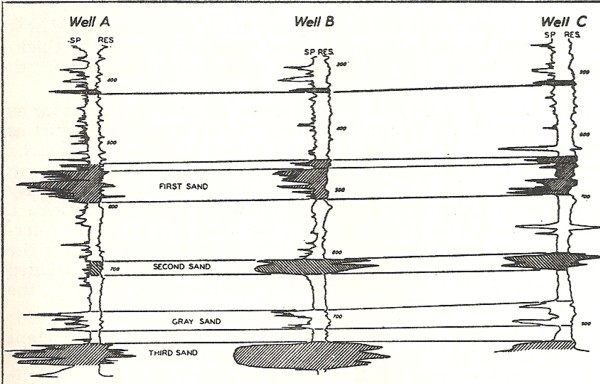
Logs from 1932 in Oil City-Titusville area, Pennsylvania, the
location of Edwin Drake's "First Oil Well" (in the USA - 6
other countries had oil wells predating this one). His well was only 69
feet deep, so it penetrated just to the top of these logs, which
found deeper and more prolific reservoirs.
Each pair of curves represents the measured data versus depth for
one well. The SP is the left hand curve of each pair; deflections to
the left (shaded) show porous rock. The resistivity is the curve on
the right of each pair. Deflections to the right (shaded) show high
resistivity, and when combined with a good SP deflection, indicate
oil zones. Some good quality rocks in this example do not have high
resistivity and are most likely water bearing.
The gamma ray log appeared in 1936. The rules
were easy: low value equaled porous reservoir or tight rocks.
High values were shale. It said nothing about fluid content.
By 1942, Gus Archie had defined a couple of quantitative methods
that turned analysis into a mathematical game, instead of just
some simple rules of thumb. His major work established a
relationship between resistivity, water saturation, and
porosity. If we knew porosity from rock samples measured in the
lab, and a few other parameters, we could calculate water
saturation from the resistivity log values. This was really new
news.
He even attempted to calculate porosity from the resistivity
log. This worked in high quality (high porosity) reservoirs but
had problems in low quality rocks or heavy oil with gamma ray
and caliper curves (far left), shear and compressional sonic travel
time curves (middle) and sonic waveform image log (right).
Depths are shown in the narrow track next to the gamma ray
curve.
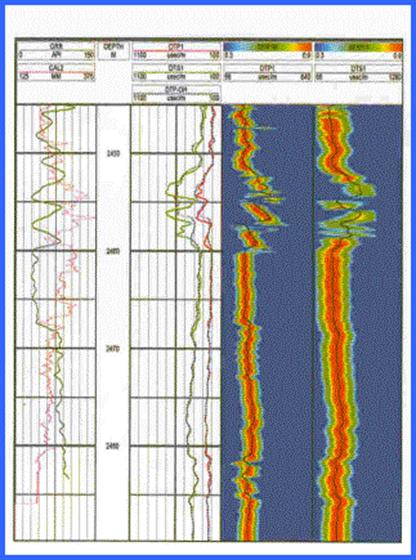 This is an example of a modern sonic log
Just after 1945, a method that investigated the response of
rocks to neutron bombardment became available. The neutron log
was the first porosity indicating well log. High values meant
low porosity or high porosity with gas. Low values meant high
porosity with oil or water, or shale. Add the gamma ray log, SP,
and resistivity and again the world was perfect, except for all
those shades of grey. Calibrating the response to porosity
depended on a lot of well bore environmental parameters (hole
size, mud weight, temperature) so it was not terribly accurate.
It wasn't until 1958 that the measurement of the velocity (or
travel time) of sound through rocks in a well bore was achieved.
It turned out that the travel time was a linear function of
porosity and a few other factors.
Shortly after 1960, another
porosity indicating log appeared that measured the apparent
density of the rocks. Porosity was a linear function of density
-- higher density meant lower porosity.
Both sonic travel time
and density as measured by these logs could be transformed into
moderately accurate porosity values, using the gamma ray to
discount shale, and the resistivity to distinguish between
salty water and oil. Fresh water was still a problem and gas
zones could only be located if a neutron log was also run.
This was the state of petrophysics when I entered the scene in
1962. The rules were obvious, the
math was easy. And running the logging tools into the well bore
meant lots of travel. I loved the job. There were no computers
on every desk, calculators were bigger and heavier than
typewriters, so the quantitative work was done with pencil and
paper or sliderule. Anybody know what a sliderule is?
 Later, with sidetracks into seismic data processing, reservoir
engineering, project management, and seismic data center
management, I finally noticed that petrophysics was the underlying
foundation of much of geology, geophysics, and reservoir
engineering. Later, with sidetracks into seismic data processing, reservoir
engineering, project management, and seismic data center
management, I finally noticed that petrophysics was the underlying
foundation of much of geology, geophysics, and reservoir
engineering.
That realization led me to my consulting and teaching career. I got to see a lot of
the world, wrote
a dozen or more
software packages, analyzed the log data from thousands of
wells, and saw even more of the world,
This may be the only editorial
cartoon ever published in a newspaper (Calgary Herald, circa
1974 - 75) concerning petrophysical analysis.
That's me peering down a borehole on Melville Island NWT,
estimating the gas reserves to be "four trillion cubic feet".
The final value was closer to 17 trillion. I was the log analyst
and logging supervisor on about 140 wells in the Canadian Arctic
across a 10 year period. We didn't use our eyeballs to look into
the wellbores directly, of course; we used well logs and
calculations based on those measurements
to do what our eyes could not.
We now call the business "Integrated Petrophysics" because we
use much more than well log data to get our answers. Lab data from
core analysis, such as porosity, permeability and grain density,
are critical input parameters used to calibrate our work. More
exotic lab measurements have become more common as we move into
unconventional reservoir types like shale gas and tight oil
prospects.
The rest of the
articles in this chapter will cover how we use modern logs and
will provide all the geoscience background you'll need to
understand petrophysics.
Check out the
"This Chapter" menu at the right to see where we are headed.
TYPES and USES OF WELL
LOG and LABORATORY DATA
The table
below might not mean too much to someone who is not in the oil, gas,
or mineral development business, but it will give everyone an idea of the scope
of work, wealth of data types, and the multiplicity of uses to
which
petrophysical data can be applied. Although oil and gas
dominate the list, uses in aid of sedimentary minerals, potable and
near-potable water, helium and other inert gases, blue and green
hydrogen, CO2 storage, geothermal energy, and lithium
extraction from brine have been in use in many areas of the world.
|
|