 Temperature logging began around 1846
when William Thomson (Lord Kelvin) made measurements of
temperature in water wells in England. His first technical paper
on the subject was "Age of the Earth and its Limitations as
Determined by the Distribution and Measurement of Heat within
It". Kelvin's calculated age was 20 - 40 million years.
Since radioactivity had not
been discovered yet, Kelvin was unaware of the heat generated
internally from this source, so he can be excused for a
100-fold error in his estimate of the Earth's age. Controversy,
debate, and a slew of additional papers ensued for another 50
years. Temperature logging began around 1846
when William Thomson (Lord Kelvin) made measurements of
temperature in water wells in England. His first technical paper
on the subject was "Age of the Earth and its Limitations as
Determined by the Distribution and Measurement of Heat within
It". Kelvin's calculated age was 20 - 40 million years.
Since radioactivity had not
been discovered yet, Kelvin was unaware of the heat generated
internally from this source, so he can be excused for a
100-fold error in his estimate of the Earth's age. Controversy,
debate, and a slew of additional papers ensued for another 50
years. The first wireline temperature log was run in 1933. Many modern logging tools have a temperature sensor built-in, so a separate device is not always needed. These are not highly accurate but sufficient for most petrophysical analysis models. High resolution and rapid response temperature logs are needed for some reservoir engineering tasks, such as gas leak and crossflow detection. The temperature sensor is a thermistor exposed to the borehole fluid. A platinum element is usually used, as the electrical resistance varies linearly with temperature over a wide range and is stable over time. According to PetroWiki, "The temperature tool is most effective when located at the bottom of a tool string. In a production well, the tool should always be logged downward so as to enter undisturbed fluid. The log should be recorded at a constant logging speed, not to exceed 30 ft/min."
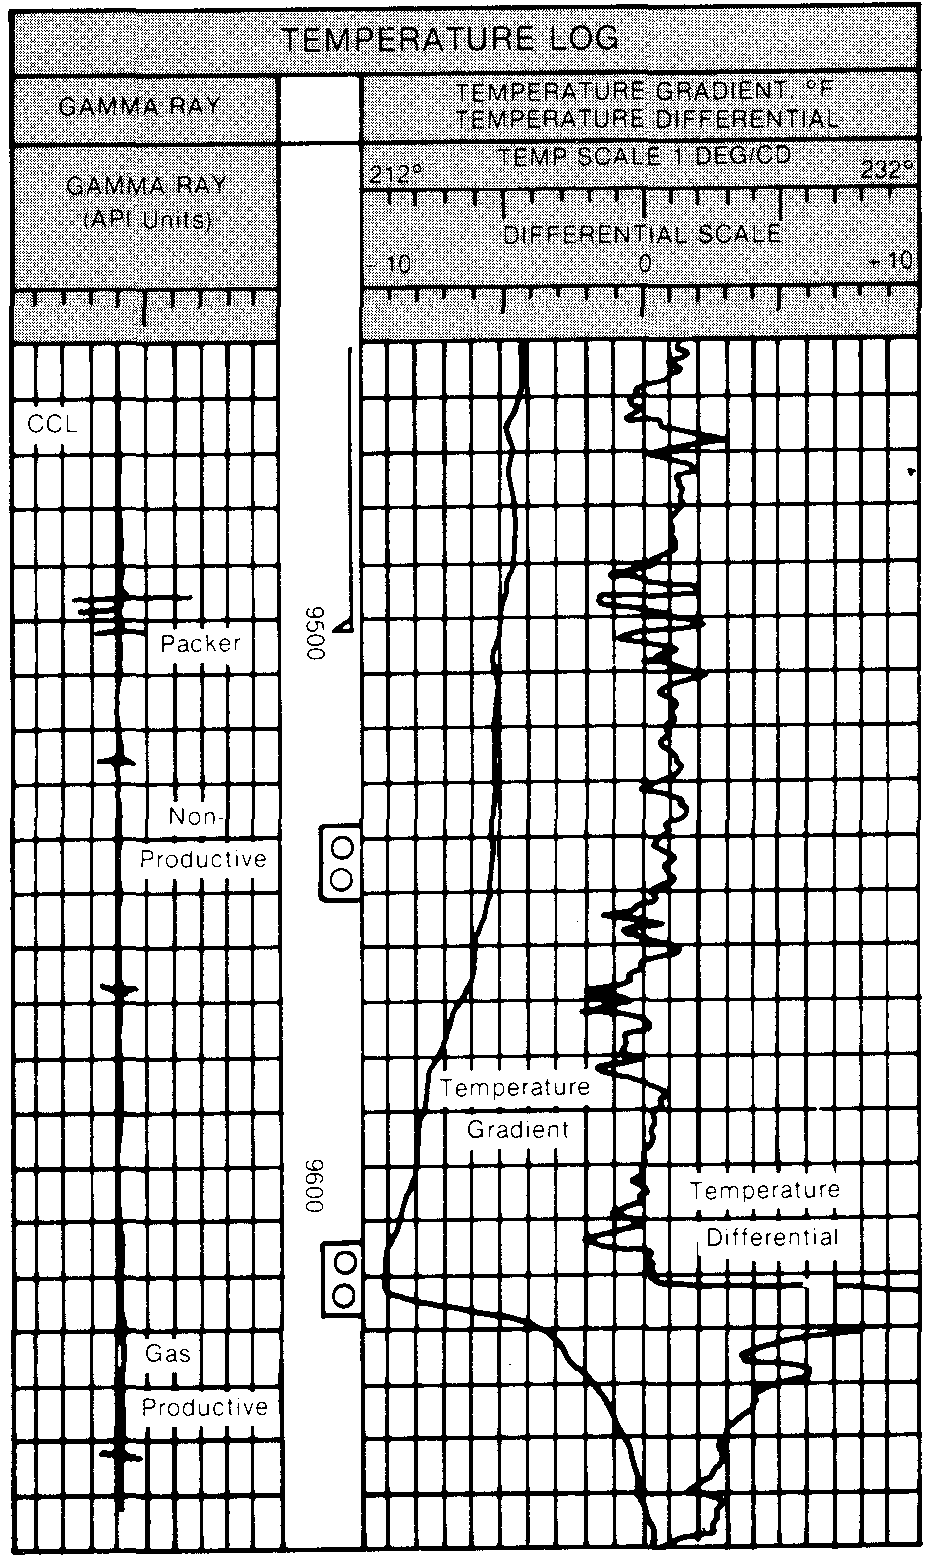
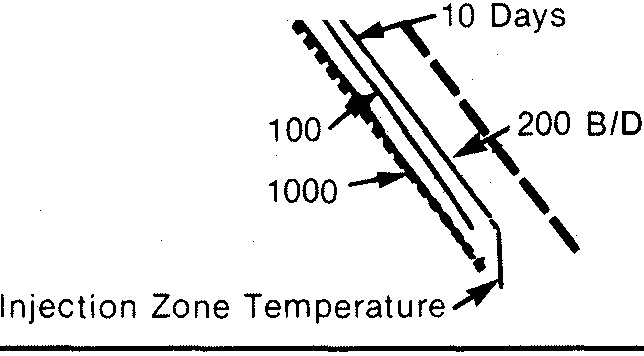
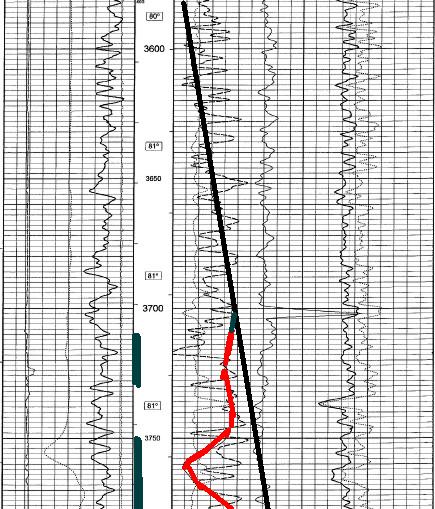
They have been widely used to assess completions in producing and injection wells. Here are two examples.
The "forgotten" log, the temperature survey in open hole, might be useful if some gas has evolved into the wellbore prior to logging. There is a temperature sensor on most modern logging tool strings - just ask for it to be displayed.
|
|
||
|
Page Views ---- Since 01 Apr
2020
Copyright 2023 by Accessible Petrophysics Ltd. CPH Logo, "CPH", "CPH Gold Member", "CPH Platinum Member", "Crain's Rules", "Meta/Log", "Computer-Ready-Math", "Petro/Fusion Scripts" are Trademarks of the Author |
|||

|
||
| Site Navigation | TOOL PROFILES TEMPERATURE LOGS | Quick Links |

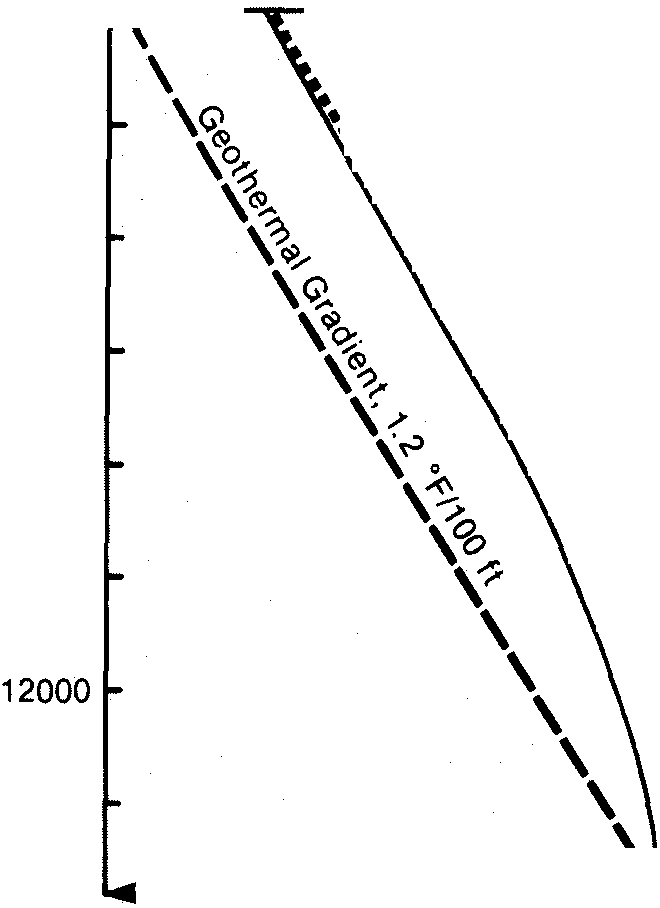
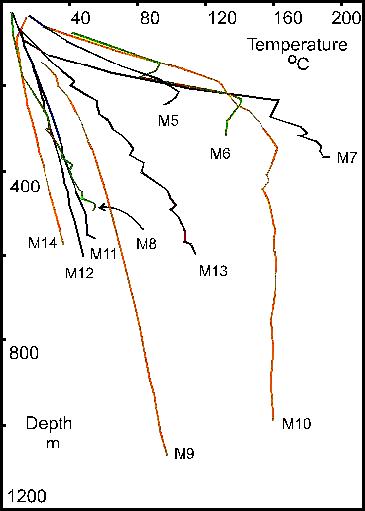 Temperature
logs in geothermal wells are essential for both exploration and
development.
Temperature
logs in geothermal wells are essential for both exploration and
development.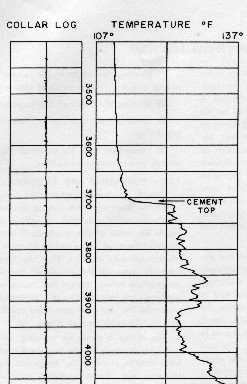 Back
in
the “good old days” before the invention of sonic
logs, there was no genuine cement integrity log. However, the
location of the cement top was often required, either to satisfy
regulations or for general knowledge. Since cement gives off heat
as it cures, the temperature log was used to provide evidence
that the well was actually cemented to a level that met expectations.
Back
in
the “good old days” before the invention of sonic
logs, there was no genuine cement integrity log. However, the
location of the cement top was often required, either to satisfy
regulations or for general knowledge. Since cement gives off heat
as it cures, the temperature log was used to provide evidence
that the well was actually cemented to a level that met expectations.