|
 RADIOACTIVE SANDSTONE BASICS
Radioactive sands
have often
been mistaken for shale during an initial review of well
logs. This means we might miss potential pay zones unless we
integrate all the available log, core, sample, and laboratory data.
If the geologist tells us the zone is a quartz or feldspar
sandstone based on detailed sample descriptions, it cannot be a true
shale regardless of of what we see on the gamma ray log.
Note to non-oilfield people and journalists who may read this page:
the radioactivity levels in sedimentary rocks do not pose a threat
and are lower than that of a red- brick building.
Radioactivity in rocks can come from uranium, potassium, or thorium,
the three most common naturally occurring radioactive elements.
Feldspar sands are the product of erosion and weathering of granite,
sometimes transported a considerable distance from the granite
source by rivers and streams. These usually called granite wash
sands. Here the radioactivity is from the potassium in the feldspar.
Weathering of granite can also produce porosity within the granite
itself, and
normal migration paths may bring oil to the porous
reservoir. There are very large granite reservoirs offshore
Viet Nam and smaller ones in many other countries, including
the USA. These reservoirs are often called "bald
highs".
The total gamma ray log is not useful as a clay or shale indicators
in granite wash or granite reservoirs. The lack of separation
between neutron and density porosity curves on a sandstone scale
will confirm that clay content is very low or zero in these
reservoirs. Low values on the thorium curve of a spectral
gamma ray log should confirm this. Granite wash reservoirs may
be very fine-grained, leading to moderately high irreducible water
saturation. Granite reservoirs may be fractured, leading to other
complications on assessing water saturation..
Uranium salts can migrate with geothermal water during diagenesis of
sands, shaly sands and silts, and carbonates. It may also migrates
into the reservoir with the oil. The uranium is often associated
with kerogen in organic rich source rocks or the kerogen found in
most unconventional shale gas and shale oil plays.
Thorium is associated mostly with clay minerals, although small
quantities can be found in relatively clean sandstones. This means
that the thorium curve on a spectral gamma ray log could be used as
a clay or shale indicator in uranium bearing rocks.
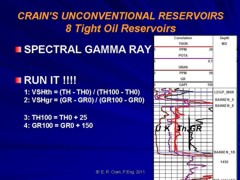
FELDSPAR SANDSTONE
 Here
is an example of a radioactive interval that needs a quick look
analysis. If you think like a detective, the answers usually come to
light. Gather the evidence, assess the evidence, discard the
impossible, select the most probable from what remains. In general,
the simplest solution is often the best choice. Here
is an example of a radioactive interval that needs a quick look
analysis. If you think like a detective, the answers usually come to
light. Gather the evidence, assess the evidence, discard the
impossible, select the most probable from what remains. In general,
the simplest solution is often the best choice.
 We have a
zone
that is radioactive and looks like a shale on
the gamma ray log. The density neutron porosity curves on sandstone
scale however show zero separation, so this interval cannot be a
shale. This lack of separation is correct for quartz or feldspar
sand. It is radioactive so it can't be quartz, so feldspar it is! We have a
zone
that is radioactive and looks like a shale on
the gamma ray log. The density neutron porosity curves on sandstone
scale however show zero separation, so this interval cannot be a
shale. This lack of separation is correct for quartz or feldspar
sand. It is radioactive so it can't be quartz, so feldspar it is!
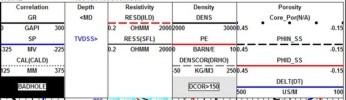
Composite raw
data plot for radioactive feldspar sand
This example has no gamma ray
spectral log. It would have been a help, but is not essential since we know
the area and the density neutron curves answer all the
questions about porosity and lithology.
There is a second issue though,
and that is the low resistivity over most of the sand interval.
suggesting a water zone. The highest resistivities are in tight
anhydrite and dolomite above the sand. The best resistivity in the sand is just 2
to 3
ohm-m in the top 1.5 meters of the sand and the water zone is 0.4 to
0.8 ohm-m, a contrast of about 4:1. An old
rule of thumb suggests that a ratio of 3:1 or better means we should
complete the well, as long as the porosity is about the same in both
the water and oil legs.
A test on the top of the sand in
the well on the left, below, produced clean oil, but water cut
increased after about six months production. A second well at the
right was drilled and tested water with some oil. The resistivity
log signature is only very slightly different than the first well.
Visually there is not much difference between them.
Detailed
petrophysical analysis does show subtle differences. The well on the
left shows a 2 meter pay zone on either a long transition zone or a
depleted oil zone of about 7 meters. The second well shows only a
half meter of pay on top of the same transition zone. The test and
production results are confirmed by the fluid distribution in the
two wells. And there is not much that can be done to improve the oil
production.

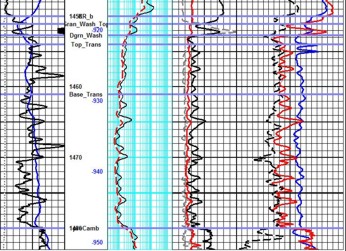
Actual saturation (blue curve in
Track 3) compared to irreducible water saturation (black curve) in
two wells. Where the two curves are close together, little water
will be produced at initial completion. Where they are separated,
water will flow with the oil. Production histories on these two
wells bear out this interpretation: the well on the left produced
clean oil for six months, the other tested water with oil
immediately.
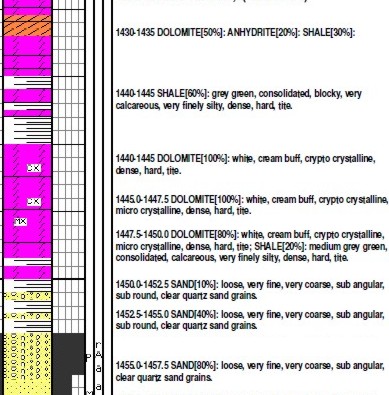
A
good wellsite geologist will correlate his description to the
shape of the drilling time log. Later, the sample depths may be
adjusted to the open hole logs, especially gamma ray, resistivity,
and density logs. In this pair of wells, the first hint of the
feldspar sands is in the wellsite sample descriptions as shown
below.
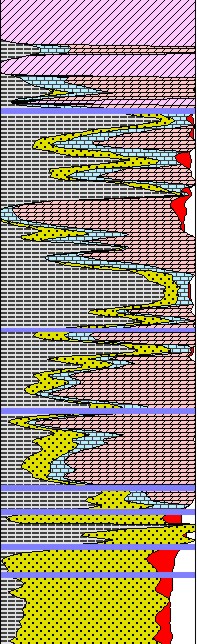 
Log analysis lithology plot (left) in a complex sequence, and sample
description plot (right) over the same interval.
Although the lithology description is not usually quantitative,
it is an essential ingredient in choosing the correct mineral
mixture for the log analysis lithology calculation. A little
care is needed to read these logs. In this case, the word "SAND"
describes the rock texture, not its mineralogy. This is a
radioactive sand so it must contain feldspar (decomposed
granite) and possibly some quartz, as well as the dolomite and
anhydrite layers above the sand. Shale, of course must be
handled by an appropriate method. In this case, shale cannot be
found using the GR inside the radioactive sand interval.
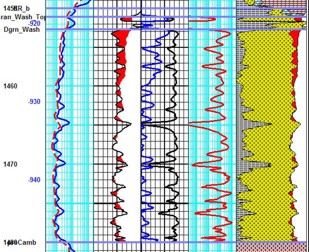
URANIUM RICH SANDSTONE / SILTSTONE
Again we will use our detective skills to sort out the
conflicting evidence from the logs shown below. This is a Bakken
Sand interval with the Upper and Lower Bakken Shales bounding the
sand/silt interval. These shales have very high organic content and
are the source rocks for the oil in the Middle Bakken Sandstone.
They are also very radioactive, more than 300 API units. This is a
clue that uranium may be present as most shales seldom exceed 150
API units.
The sand is also radioactive, averaging 120 API or higher. The
potassium, thorium, and uranium curves are in Track 1 with total
gamma ray. Uranium content is roughly constant in this example,
giving a constant shift to the total GR counts. The thorium curve
shows some character but samples and core description indicate clay
volume is less than 5%, distributed as burrows and microscopic
discontinuous bands.
The density neutron porosity on a sandstone scale is sufficient to
indicate dolomite, but the samples suggest a dolomitic quartz sand.
Further investigation with XRD shows a 50:50 mix of quartz and
dolomite with a few percent pyrite. The pyrite is sufficient to push
the neutron porosity a little bit higher and the density porosity a
little bit lower, increasing the separation enough to mimic the
dolomite effect. Porosity is still halfway between the density and
neutron porosity and no shale correction is needed.
The resistivity in the shales is quite high and the sonic, density
and neutron all read high, suggesting coaly material. The PE curve
disputes this as coal would be less than 1.0 and these shales have a
PE of more than 3, representing the mix of clay, silt, and kerogen.
The resistivity in the sand is only 3 or 4 ohm-m, which looks wet.
But the very fine grained sand and silt have naturally high
irreducible water saturation. This, coupled with a saturated-salt
formation water, end up giving a water saturation between 40 and
50%. Clean oil production with small water cut proves the case.
Deeper in the basin, the rock becomes more calcitic instead of
dolomitic, porosity decreases, resistivity increases, and the zone
looks more "normal" but it is still just as radioactive. CAUTION:
along the northern edge of this play, water resistivity increases
significantly, leading to 15 ohm-m sands that are 100% wet.
But it took 50 years from the first producing well to convince oil
company management that this would become the largest oil field in
North America. New technology, in the form of horizontal wells and
massive hydraulic fracturing jobs, helped turn the mindset around.
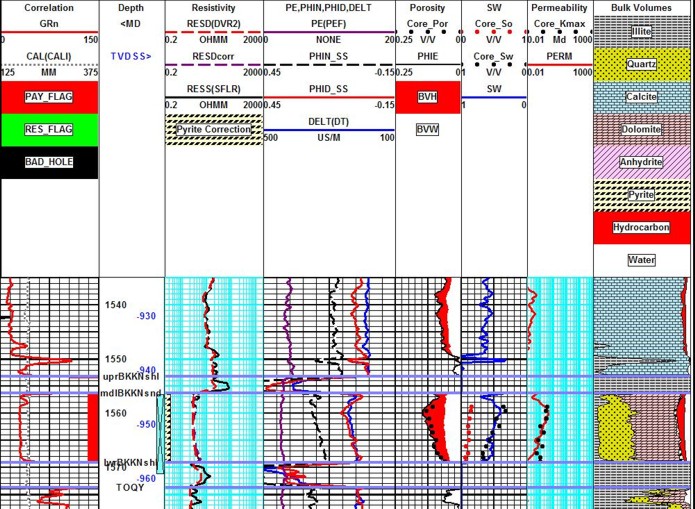
Bakken “Tight Oil” example has no kerogen in the productive sand /
silt section but very high kerogen content in the shales above and
below. Zone is radioactive due to uranium carried from the source
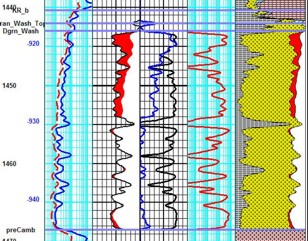
rocks during oil migration. Log example showing core porosity (black dots), core oil saturation (red dots).
core water saturation (blue dots), and permeability (red dots). Note
excellent agreement between log analysis and core data. Separation between red dots and blue
water saturation curve indicates significant moveable oil, even
though water saturation is relatively high (see text below for
explanation). NOTE that the organic rich Upper and Lower Bakken
Shales are much more resistive than the Middle Bakken Sand/Silt pay
zone due to the high TOC content in the shale. There is no
significant kerogen in the sand itself.
|