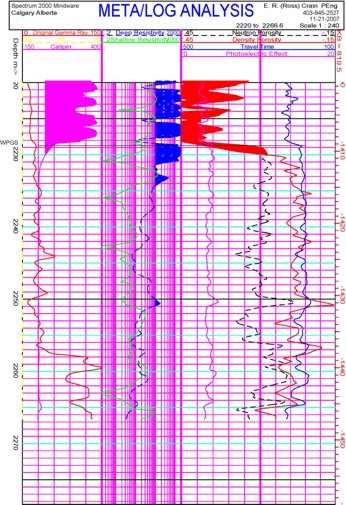
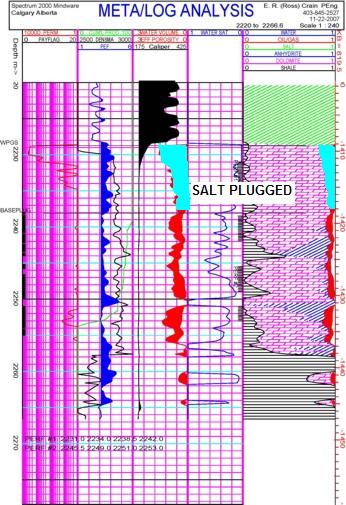
There may be oil or gas or water in porosity below the plugged porosity. Oil or gas will usually show lower resistivity than the salt plugged porosity, due to the irreducible water in the reservoir, which is usually saturated salt water. Water zones are usually saturated salt water and very low resistivity. Tight zones will have resistivity like the salt plugged interval, but the porosity logs will show little porosity. So with the skill of a CSI detective, you can find the evidence, assess the evidence with logical deduction, and nail the guilty party. The pulsed neutron log is strongly influenced by chlorine, so this tool ought to be useful in calculating the amount of plugging. Some reservoirs are only partially plugged and the conventional logs don't have enough resolution to distinguish partial plugging. If the porosity is completely
plugged and the matrix lithology is known, you can calculate the
plugged porosity from the density log equation: Salt plugged reservoirs are found in the Winnipegosis in Saskatchewan and Alberta, and the Niagaran reef plays in Michigan and Ontario. When depleted, they make excellent gas storage sites.
|
|
||
|
Page Views ---- Since 01 Jan 2015
Copyright 2023 by Accessible Petrophysics Ltd. CPH Logo, "CPH", "CPH Gold Member", "CPH Platinum Member", "Crain's Rules", "Meta/Log", "Computer-Ready-Math", "Petro/Fusion Scripts" are Trademarks of the Author |
|||

|
||
| Site Navigation | CASE HISTORY SALT PLUGGED DOLOMITE ABOVE OIL WATER | Quick Links |