
|
||||||||
|
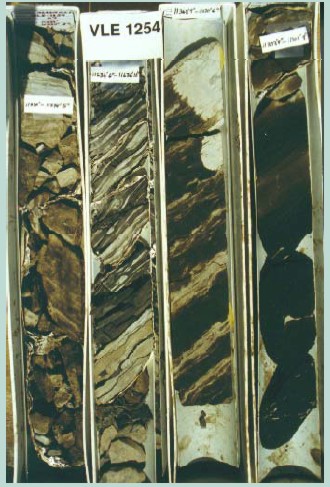
Digital Imagery provides an easily accessible visual record of a core, core plugs, well cuttings, and thin sections. Imagery is digitized at either microscopic or near-microscopic resolution. It also serves as a source of petrologic and petrophysical data. Under ultra-violet light, oil fluoresces, so photos in both natural and UV light need to be taken. |
 X-Ray Computed
Tomography (CT) ANALYSIS
X-Ray Computed
Tomography (CT) ANALYSIS
X-ray computed tomography is now the
industry-wide technology for whole-core
inspection at the macro level, core-log correlation, and plug
sample characterization. Standard output
includes CT radiograph plus axial CT scans. Plug
scans may also include both longitudinal and
axial CT scans.
X-Ray CT Scan
Images
Digital Rock Physics from Macro, Micro, and Nano CT Analysis
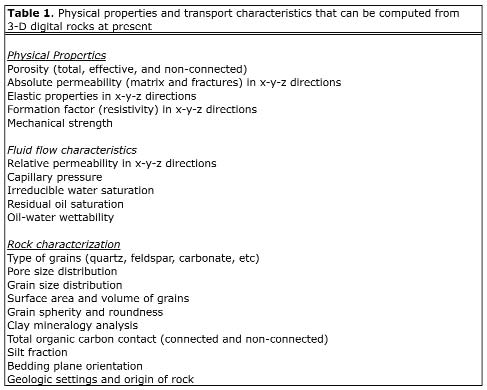
 Digital Rock Physics is a term
used to describe more detailed analysis of CT Scan images. First,
higher resolution images than conventional CT scans are made. Then
the pore size and shape are quantified in three dimensional space,
and a series of well defined equations are used to generate computed
rock properties, such as porosity, permeability, capillary pressure,
relative permeability, electrical properties, mineralogy, elastic
properties, and so on. Some of these can be defined in the three
primary directions (X, Y, and Z directions). Total, effective,
connected, unconnected, and fracture porosity can be derived.
Permeability as low as a few nanoDarcies can be detected. Samples
can be taken from cores, core plugs, or drill cuttings. The latter
allows measurement of quantitative rock properties without coring -
a significant cost saving on current wells and an invaluable source
of new information on older wells.
Digital Rock Physics is a term
used to describe more detailed analysis of CT Scan images. First,
higher resolution images than conventional CT scans are made. Then
the pore size and shape are quantified in three dimensional space,
and a series of well defined equations are used to generate computed
rock properties, such as porosity, permeability, capillary pressure,
relative permeability, electrical properties, mineralogy, elastic
properties, and so on. Some of these can be defined in the three
primary directions (X, Y, and Z directions). Total, effective,
connected, unconnected, and fracture porosity can be derived.
Permeability as low as a few nanoDarcies can be detected. Samples
can be taken from cores, core plugs, or drill cuttings. The latter
allows measurement of quantitative rock properties without coring -
a significant cost saving on current wells and an invaluable source
of new information on older wells.
![]() Digital Rock Physics
Digital Rock Physics
The list above shows the breadth of quantitative data that can be developed from digital rock physics CT scans. Considerable super-computer power is required to manipulate the 3-D data set through the numerous heavy-duty equations. One day, the technique will be turned inside-out, as was done for the NMR method, and micro CT scans will become a borehole well log. In the meantime, grap your sample chips and start re-logging those critical unconventional reservoirs..
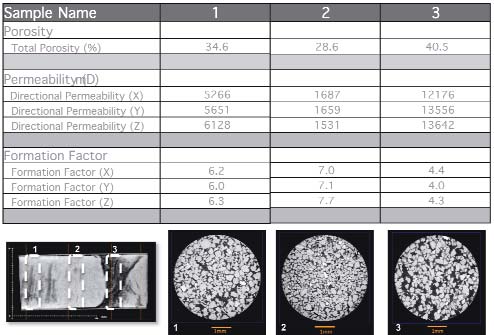
Macro Level Properties =![]()
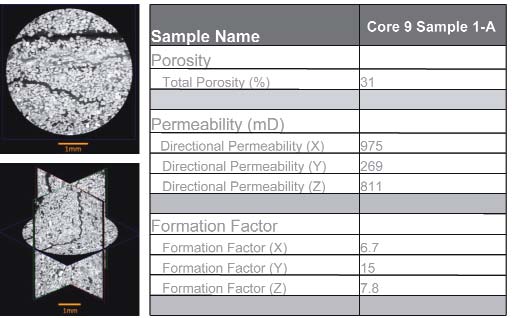
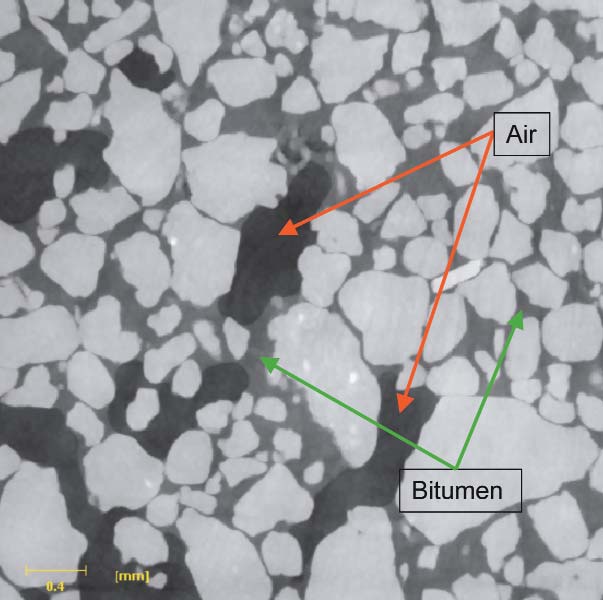
![]() Micro Level Properties
Micro Level Properties
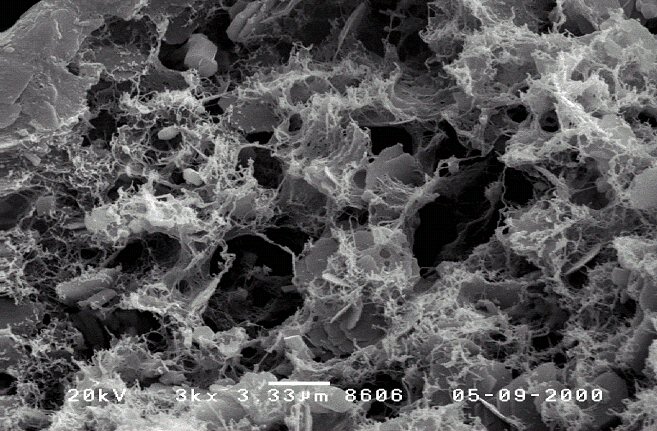
Nano Level Properties in Shale ![]()
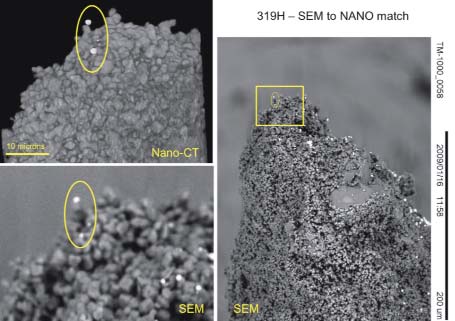
White = Porosity
X- Ray Fluoroscopy
High-resolution fluoroscopy provides the ability
to perform quantitative image analysis,
including a high resolution density log of the
entire core. Each scan contains X-Ray density
standards. The log provides an important record
of variations in lithology and porosity
throughout the length of the core. This provides
approximate porosity and lithology estimates
before the core is even slabbed.
![]() SPECIAL CORE ANALYSIS MEASUREMENTS
SPECIAL CORE ANALYSIS MEASUREMENTS
Special Core
Analysis (SCAL) provides specific information to characterize a
particular rock property, or through a selection of specialized
tests, provides a more complete understanding of a reservoir rock.
Electrical property measurements are made using either the porous plate or dynamic displacement technique. Most labs have the capacity to test using either 2 or 4 electrode measurements at reservoir conditions. Data include resistivities (Rw, Ro, Rt), formation factor (F), resistivity index (I), cementation and saturation exponents (M and N), and CEC, Qv, and Co-Cw analysis for clay-corrections.
 Capillary
Pressure
Capillary
Pressure
Capillary pressure measurements are available using porous plate,
high-speed centrifuge, or mercury injection techniques. Porous plate
measurements can be performed at ambient and/or elevated
temperatures. Centrifuge data is currently limited to ambient or
moderate temperatures. PTS is equipped with 2 automated
Micromeritics mercury injection porosimeters for testing at
pressures up to 60,000 psi.
Relative
Permeability
We encourage early consultation
with our clients in an effort to design relative permeability test
programs that are consistent with processes in the field. PTS offers
a full complement of relative permeability tests including:
|
Wettability Testing
Knowledge of the wettability of a reservoir rock is a key factor for
determining oil recovery mechanisms and making estimates of recovery
efficiency. PTS offers industry-standard Amott and Modified USBM wettability tests, including the USBM test at elevated temperatures.
For samples that have been subjected to weathering, PTS offers
sample restoration in crude oil at reservoir temperature.
Pore Volume
Compressibility
Hydrostatic pore volume compressibility testing is a routine
offering for 1-in., 1.5-in. and 2-in. diameter samples and pressures
up to 10,000 psi. Cyclic compression and decompression tests, as
well as failure point determination tests, are also available. PTS
has in-house capabilities to perform uniaxial or triaxial stress
testing. Advanced geomechanical determinations are also available.
NMR Analysis
PTS Labs is equipped with a
state-of-the-art Maran Ultra NMR core analyzer, and flow-through
core holders capable of testing at both ambient and reservoir
conditions. For calibration with downhole logging tools, the
instrument can match pulsed NMR tool magnetic strength and T2 echo
spacing. NMR determinations include:
|
![]() PETROGRAPHIC ANALYSIS
PETROGRAPHIC ANALYSIS
Petrographical analyses is an essential service providing estimates
of pore size distribution, grain size, sorting, porosity and mineral
abundances, fabric, rock classification, porosity varieties and
abundances.
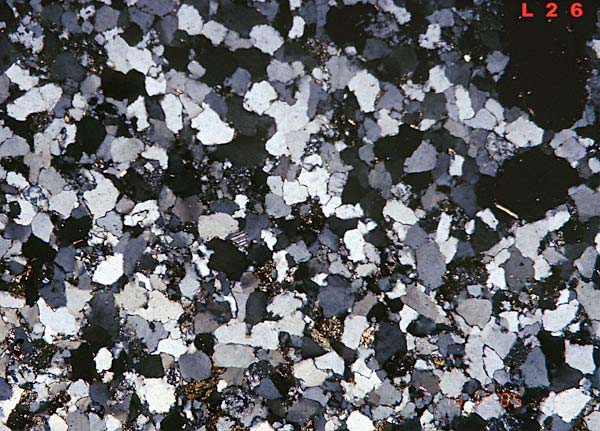 Detailed thin section analysis includes measurement of mean grain size, sorting, and point count determination of mineral abundances and porosity (minimum 300 points per thin section). Results include a determination of Vshale, shale distribution, porosity varieties and abundances with a discussion of diagenesis, diagenetic sequence, porosity origins and development, controls on porosity and permeability. Point count data is presented in tabular form with color photomicrographs accompanied by detailed descriptions.
|
|
Copyright 2023 by Accessible Petrophysics Ltd.
CPH Logo, "CPH", "CPH Gold Member", "CPH Platinum Member", "Crain's Rules", "Meta/Log", "Computer-Ready-Math", "Petro/Fusion Scripts" are Trademarks of the Author