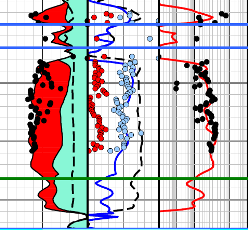
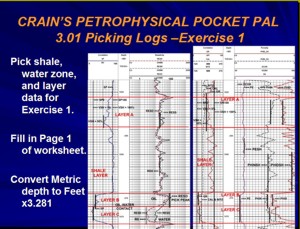
By summarizing the key issues, and how the routine open-hole tools respond and are used, one is able to focus their efforts in a more efficient manner. There are, of course, exceptions to virtually every rule, which is why experience in a specific field is of such value. Long experience, with many
wells successfully drilled, does not of itself eliminate surprises.
In one example, with 120 successful wells drilled (45 of which were
cored), a completely unexpected poor formation was encountered in an
area previously drilled. And so one returns to the value of
understanding
Sandstones (SiO2), on the other hand, are typically clastic in origin and consist of fragments of material that were originally deposited elsewhere, broken up and transported via water or wind, and re-deposited. .While carbonates can be clastic, this is much less common than the ‘in place’ origin. In the sandstone world, complications are often associated with ‘clay/shale’, although other issues (such as feldspar, glauconite) arise in certain provinces. Clay, silt, and shale are the common obstacles present in sandstone evaluation. The exact meaning of these terms is sometimes dependent upon location, and context, but a general definition is one of grain size, with shale being a consolidation of both silt (4 to 74 um) and clay (< 4 um) sized particles. Clay usually consists of one
(or more) of the following minerals: chlorite, illite, kaolinite and
smectite. In contrast to both sand and carbonate, these materials
are electrically conductive, and therein lies one of the fundamental
distinctions in carbonate vs sandstone formation evaluation:
resistivity will be lowered Clay distribution mode, in addition to the volumetric amount, is also an issue – structural, dispersed and laminated – and impacts both the associated electrical circuit and appropriate adjustment to porosity. Perhaps surprisingly, the
question of dispersed or laminated geometry (pore systems) is also
an issue with carbonates. In a recent Topical Conference the five
most common causes of Low Resistivity Pay in Carbonates were ranked
as (most to least common): Sandstones are then clastic in origin with diagenesis typically limited to compaction and cementation. Carbonates, which are more soluble in water, have usually grown in place, and then evolved via cementation, compaction, dolomitization and dissolution. The importance of dissolution is immediately apparent in the carbonate outcrops, road cuts, and caves of the Midwest USA.
In many regards, the key
distinction between sand and carbonate, is then one of clay effects
versus pore size distribution.
There is, to our knowledge, no direct, general relation between the magnitude of SP deflection and the actual value of porosity and/or permeability. It’s rather a Vclay indicator, to be fed into the downstream calculations just as other indicators are. Carbonates, with their wide range of pore sizes, result in a less well defined SP response, and the SP measurement is not even displayed in many carbonate. Natural gamma ray activity
arises from three sources: potassium40, daughter products of
Thorium232, and uranium238. In the clastic world, GR activity is
often (but not always) a result of clay, and therefore indicative of
a decrease in rock quality. It is for this reason that Vclay
calculations nearly always include the GR as one estimator (linear
as below, or some other functional form). When faced with variable clay types, or the possibility of additional radioactive components, it’s a very good idea to supplement the GR Vshale estimates with alternatives from the SP and / or density neutron. For example, we have seen shallow horizon clastic intervals (above the expected pay), logged with only GR / SP / Sonic for which there was very little indication of reservoir quality rock by the GR, yet the SP clearly revealed potential (which was validated with production). And in the cleanest of these intervals, Rw(SP) was in agreement with independently derived values, suggesting that the measurements were valid. Confusion can arise by failing to clearly distinguish between shale and clay. Bhuyan (1994) found a common error to be the assumption that shales are 100 percent clay whereas in fact shales are commonly composed of 50 to 70 percent clay, 25 to 45 percent silt- and clay-sized quartz, and 5 percent other minerals. In our experience, there is
also a tendency to sometimes regard the rock as being composed of
sand – silt – clay, in the absence of any silt compositional
information, and in the face of likely (even verifiable) vertical
clay compositional variations. We have also found that when the logs
are compared to core, relatively few sedimentary laminations within
‘clean’ sand bodies can give rise to log responses that are then
interpreted as reflecting a silt interval. One is sometimes (but not
always) able to work with the more simple sand – shale model and
develop from there 3-D geological models that are just as reasonable
as the three A final word about clastics: KCl mud may be used for borehole stability and will shift the GR upwards: the effect must be accounted for if the GR is to be used for Vclay. Uranium-bearing minerals are rare but soluble, transported easily and can be precipitated far from their source. In carbonates it’s not uncommon to find the GR being driven by uranium, in a fashion that is not necessarily indicative of rock quality. The presence of uranium, and the associated higher GR, can signal stylolites, fractures, super-perm and / or general increases and decreases in quality
Spectral GR data is
particularly useful in the interpretation of carbonate GR responses.
In today’s world of highly deviated wells, for which the tools may
be pipe-conveyed, one must also be alert for tool-induced GR
response. The GR module is typically at the top of the string, and
when data is acquired going into the In many regards, the key
distinction between sand and carbonate, is then the utility and
meaning (or lack thereof ) of SP / GR response.
Sandstone porosity is normally
thought of as consisting of Total and Effective, with the two being
related by the following equation (or something similar): Common porosity estimators are the density, neutron and sonic, used individually, in tandem, or all three together. In some (shaly) sands the density, by itself, will yield a reasonable estimate of PHIt across concentrations of 0 <= Vsh <= Vsh Cutoff and PHIt > PHIcutoff.
The illustration above shows
the situation, which we have found in a variety of provinces. This fortuitous event happens
because: An alternative porosity estimator is the neutron log, which is subject to many more environmental corrections (than is the density), in addition to experiencing a relatively larger shale effect and potentially large light hydrocarbon suppression. If a valid neutron log is available, the density-neutron combination offers a common solution to the shaly sand porosity problem. The third routine porosity estimator is the sonic log, which requires no environmental correction, but like the neutron, will often be more sensitive to shale. One should also be aware of the ‘adjustments’ to the acoustical porosity that may be necessary in ‘soft rock’ country: sometimes in country that is not thought of as soft rock. Per the Schlumberger Principles Manual, and observed in our own experience, if the bounding shales have travel time >100 us/ft, both of the common porosity transforms (Wyllie and Raymer) may require a correction factor. Shale travel time of 90 to 100 us/ft may not be thought of as soft rock country, yet we have encountered core – log comparisons which demonstrated the need for the compaction adjustment. Carbonate porosity determination ( Jerry Lucia, 2004), as contrastedto sandstone, is a completely different issue. Now one is faced with Interparticle (intergrain and intercrystal), and Vuggy porosity. Vuggy porosity is everything that is not interparticle,and includes vugs, molds and fractures. Vugs are divided into two types, separate and touching. One sometimes encounters the
PHItotal versus PHIeffective terminology in the carbonate
literature, but the meaning of these terms is now related to
irreducible capillary pressure water saturations, and not clay-bound
water. For example, Melas et al (1992) define PHIeffective =
PHItotal * (1-SWit), in their Porosity estimates in the carbonate world must often allow for a mix of minerals, calcite and dolomite with distinctly different grain densities – plus possibly anhydrite and halite. Determination of component percentages now requires multiple measurements and equations: two components require two measurements, etc. The neutron density combination is the common tool of choice
The z-axis is annotated with
water saturation, as a check for light hydrocarbon effects on the
porosity estimate (note that Sw drops to less than 10%). Light
hydrocarbon effects on the porosity estimate are an issue in both
sandstones and carbonates, and in both environments we have found
In addition to the multiple mineral problem, we have also found LWD density measurements, just behind the bit, for which the simple PHId estimate will not be realistic. Light hydrocarbon effects would not be nearly so evident with wireline data (which is acquired relatively longer after bit penetration and thereby allows more filtrate invasion to take place). In this case our preference is a probabilistic approach if the software is available. The need to distinguish between interparticle and vuggy porosity, will require the introduction of an additional independent tool (an additional dimension requires an additional input), and the sonic is often the (routine) tool of choice. An early documentation of this capability is attributed to Wyllie (1958), in which he plotted measured dolomite core porosity (intercrystalline, vuggy, fracture) versus compressional transit time, and observed the intercrystalline response to fall along the expected time average equation trend line, whereas the other ‘ porosity types ’were not ‘fully seen’. Conceptually, the radioactive tools respond to all porosity, while acoustical waves are more pore size dependent. John Rasmus (1983) used a comparison of PHID / PHIN ans PHIS versus Core to illustrate the effect with actual data. Anselmetti et al (1999) and
Eberli et al (2003) have followed up on this question to find that
“moldic porosity exhibits a range of responses that varies from
intercrystalline – interparticle to intraframe”. Jennings et al
(2001) summarized the situation as Physically, there is a scattering that takes place in the acoustic waves, similar to that modeled by John Rasmus et al (1985) in the dielectric log: the contrast of dielectric and resistivity responses in rock that ranges from intercrystalline / interparticle to vuggy can be used to characterize the porosity type. The dielectric will ‘see’ the vuggy oomoldic porosity more effectively than resistivity, since dielectric response does not depend on pore connectivity, but the contribution is not (initially) 100 % (Rasmus, 2004). Alain Brie has shown that the sonic “sees” approximately 20-30% of the inclusions in addition to the intergranular porosity”. Whether working in the
carbonate or sandstone world, it’s important to be alert for data
integrity issues. In a 41 well carbonate study, drawing upon more
than 30,000 core measurements, we found: Halite, if present, requires that one be aware of how the density measurement is actually accomplished. Most, but not all, elements have an Atomic Number / Atomic Mass ratio of very close to 2.0. Silicon and Oxygen, for example, are 2.01 and 2.00 respectively. Salt, on the other hand, does not satisfy this ratio and so the wireline-measured bulk density departs from the actual. Mineral
Actual Density
Tool Density In certain areas of the world, anhydrite beds are widespread and referenced for log QC purposes. In doing so, one should realize that ‘chicken wire’ appearing impurities are not uncommon, are not present in the same concentrations from one well to the next, and can give rise to genuine variations in log response. There is, finally, the question of the benchmark for porosity estimation: the core. Although the grain density is typically determined as a part of the lab procedure, it may not be included in the reported tabulations (particularly in the older reports). When included, its usefulness may not be recognized by the interpreter. The laboratory measured grain
density should be used to quality control both the core data and the
log interpretations. If the reservoir is known to consist of
limestone and dolostone, Core grain density less than 2.71 gm/cc
should raise a red flag: the core may not have been completely
cleaned or dried. Cleaning Evaluation of sandstones and carbonates typically bring different issues to the forefront. As the geoscientist of today moves from one province to another, it’s worthwhile to summarize those key differences, and thereby focus one’s attention.
From this illustration, and
similar, measurements Archie (1947) observed that the correlation
between Formation Factor (ratio of water saturated rock resistivity
to saturating fluid resistivity) and permeability was weaker than
that of FF and porosity, which suggested to him that air
permeability and ionic (resistivity) Archie’s equation, and the impact of variations in the associated parameters, can be visualized with a Pickett Plot. Considering, for the moment, ‘clean’ sand and ‘intercrystalline / interparticle carbonates’, the cementation exponent M reflects the tortuosity of the ionic electrical flow through brine saturated rock. An M of 2.0 is commonly used: smaller values correspond to a less tortuous path, with fractures being a somewhat extreme example. Should the path be ‘extra’ tortuous, such as when the pore throats are well-cemented, or a portion of the porosity is poorly connected vugs, M will increase. Be aware, however, that small pores, by themselves, don’t necessarily mean high M; it is the ‘effectiveness’ of the conduction path. The cementation exponent of both clean sand and IC/IP carbonates may vary within a relatively short (vertical) distance, and can assume a multitude of values within a given reservoir. This potential must be recognized, in order to avoid consolidating data that is in fact ‘different’. These differences may, or may not, correspond to the original depositional environment. In the words of Jerry Lucia (2004): "The foundation of the Lucia petrophysical classification is the concept that pore-size distribution controls permeability and saturation and that pore-size distribution is related to rock fabric. The focus of this classification is on petrophysical properties and not genesis. To determine the relationships between rock fabric and petrophysical parameters, one must define and classify pore space as it exists today in terms of petrophysical properties". By superimposing additional grids on the Pickett Plot, such as lines of constant Bulk Volume Water, the technique takes on additional meaning. One must remember, however that these grids are also dependent upon the underlying Archie exponents, and will themselves shift just as the Archie grids do. The saturation exponent, N, reflects the tortuosity of ionic electrical flow through the conductive phase, in the presence of a non-conductive (hydrocarbon) phase. Physically, differences in saturation exponents can reflect wettability, grain surface roughness (Diederix 1982), and possibly other variations. Again, one must heed Jerry Lucia’s comments about ‘describing the pore system as it exists today, versus the depositional environment. We have been faced with laboratory data acquired from a single depositional environment in a single well, measured in the same lab in the same way at the same time, for which the N varied from 1.5 to 3.0. Sandstone evaluation often
involves clay and the correction for its contribution to formation
conductivity (quartz being nonconductive). The clay distribution
mode (dispersed, laminated, structural) determines how the clay and
brine conductivities interact and what formulation is appropriate
for improving saturation When clay coats the sand grains, the irreducible water saturation of the formation increases, dramatically lowering resistivity values. If such zones are completed, however, water-free hydrocarbons may be produced. Structural clays occur when framework grains and fragments of shale or clay, with a grain size equal to or larger than the framework grains are deposited simultaneously. Alternatively, in the case of selective replacement, diagenesis can transform framework grains, like feldspar, into clay. Unlike dispersed clays, structural clays act as framework grains without the dramatic altering of reservoir properties. None (very little) of the pore space is occupied by clay. Dispersed clay is the most common distribution that we have been faced with (though laminated is certainly a problem in some provinces), and can be addressed with the Dual Water Model, Waxman-Smits, or several other more empirical algorithms (Worthington has authored several nice reviews). The presence of the clay offers an ‘alternative’ electrical path and thereby compromises the Archie estimates (Archie water saturations will be high). In terms of the Pickett Plot, data points shift to the Southwest, and so it’s good practice to annotate one’s Pickett Plot with SP / GR / Rhob-NPhi / etc in the ‘z’ direction. Roberto Aguilera (1990)
developed variations of the shaly sand Pickett Plot which offer the
option of ‘countering’ the Southwest shift of data. He found that
all published methods for evaluation of laminar, dispersed, and
structural clays could be written as: If one then displays Rt/A_sh vs PHIe, as compared to measured resistivity vs porosity, there is a graphical compensation for clay conductivity effects on the resulting (pseudo) Pickett Plot.
As compared to sandstones, the carbonate pore system is less often affected by clay conductivity and one is most commonly faced with variations in the pore size distribution / connectivity.
Now the Pickett Plot ‘z’ axis should be annotated with attributes that will highlight this characteristic, if present. At the extreme, one may need to supplement the porosity – resistivity evaluation with alternative techniques (image logs, dielectric log, pulsed neutron log, nuclear magnetic resonance, etc). Schlumberger has published,
in their Technical Review / Oilfield Review, three articles which
provide a more in-depth review of Archie’s equation. In many regards, the key
distinction between sand and carbonate, is then one of accounting
for clay conductivity ‘short circuits’ versus variations in pore
system tortuosity associated with changes from intercrystalline /
interparticle to vuggy porosity.
Time-lapse monitor logs and production data must be understandable within the context of the static model: the fourth dimension. It’s entirely possibly that the static model will evolve as more wells, and perhaps routine and special core data, become available, which brings one to an iterative loop. Some companies have a policy of re-examining all Fields on a scheduled, rotating basis, taking a fresh look at all (historical and newly acquired, simultaneously) data. In these time-lapse efforts it’s important to realize that even the routine tools may yield information that was not extracted the first (or second) time around. Without meaning to discount the value of new, high-tech tools in any way, there are many examples of significant advances resulting from multi-well studies based upon ‘routine’ tools In both the sandstone and carbonate worlds, there is tremendous value in multi-well evaluations and time-lapse comparisons, on a re-occurring schedule. Evaluation of sandstones and
carbonates typically bring different issues to the forefront. As the
geoscientist of today moves from one province to another, it’s
worthwhile to summarize those key differences, and thereby focus
one’s attention. |
||||
Page Views ---- Since 01 Jan 2015
Copyright 1978 - 2019 E. R. Crain, P.Eng. All Rights Reserved |